Soviet Union vs Immigrants from Belize Female Unemployment
COMPARE
Soviet Union
Immigrants from Belize
Female Unemployment
Female Unemployment Comparison
Soviet Union
Immigrants from Belize
5.4%
FEMALE UNEMPLOYMENT
21.7/ 100
METRIC RATING
200th/ 347
METRIC RANK
6.5%
FEMALE UNEMPLOYMENT
0.0/ 100
METRIC RATING
323rd/ 347
METRIC RANK
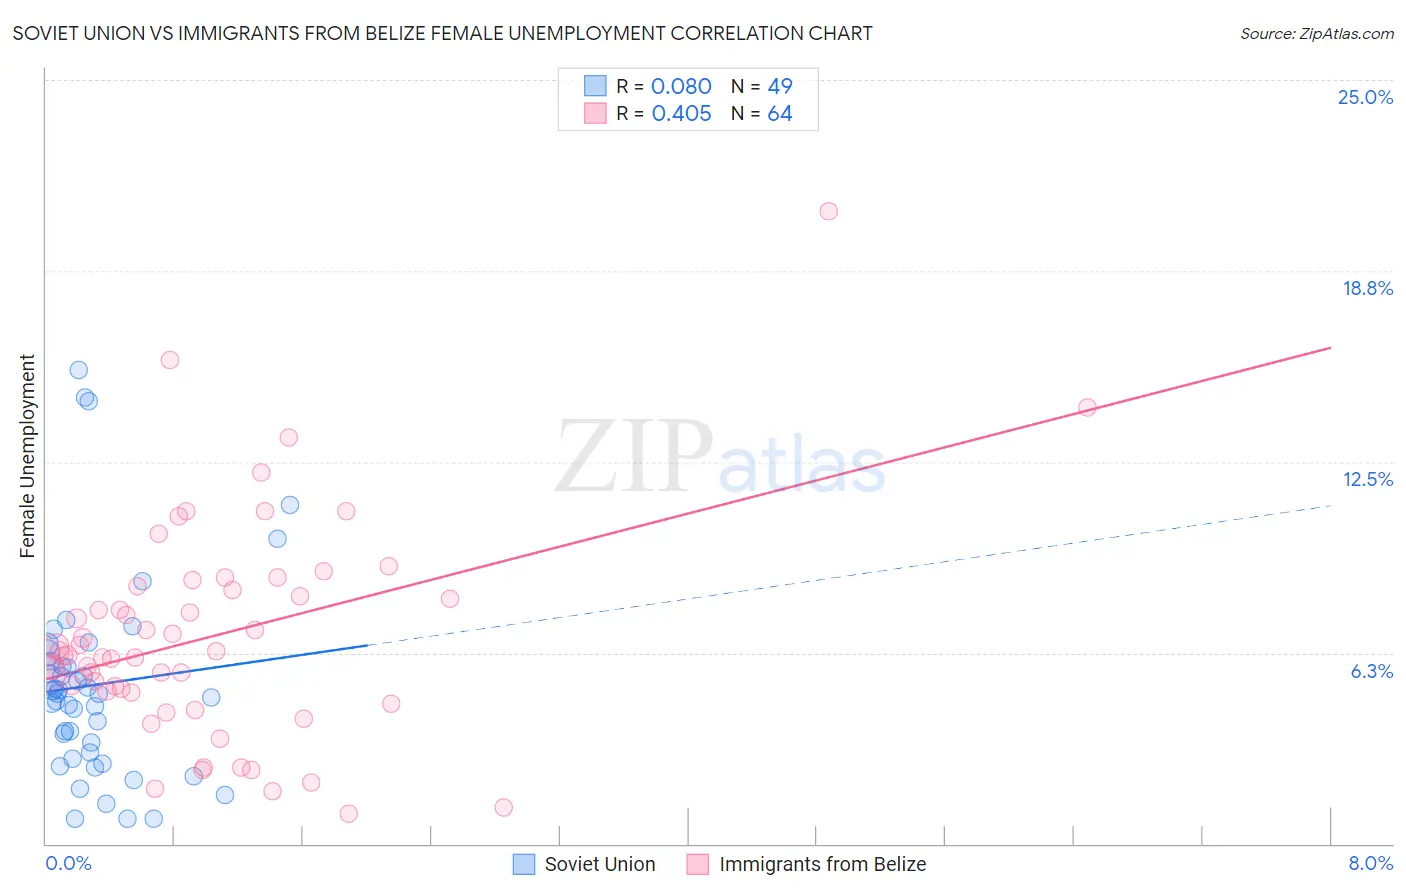
Soviet Union vs Immigrants from Belize Female Unemployment Correlation Chart
The statistical analysis conducted on geographies consisting of 43,498,217 people shows a slight positive correlation between the proportion of Soviet Union and unemploymnet rate among females in the United States with a correlation coefficient (R) of 0.080 and weighted average of 5.4%. Similarly, the statistical analysis conducted on geographies consisting of 130,161,278 people shows a moderate positive correlation between the proportion of Immigrants from Belize and unemploymnet rate among females in the United States with a correlation coefficient (R) of 0.405 and weighted average of 6.5%, a difference of 21.3%.
Female Unemployment Correlation Summary
| Measurement | Soviet Union | Immigrants from Belize |
| Minimum | 0.80% | 1.0% |
| Maximum | 15.5% | 20.7% |
| Range | 14.7% | 19.7% |
| Mean | 5.2% | 6.8% |
| Median | 4.9% | 6.2% |
| Interquartile 25% (IQ1) | 2.9% | 5.0% |
| Interquartile 75% (IQ3) | 6.1% | 8.4% |
| Interquartile Range (IQR) | 3.2% | 3.4% |
| Standard Deviation (Sample) | 3.3% | 3.6% |
| Standard Deviation (Population) | 3.3% | 3.5% |
Similar Demographics by Female Unemployment
Demographics Similar to Soviet Union by Female Unemployment
In terms of female unemployment, the demographic groups most similar to Soviet Union are Hawaiian (5.4%, a difference of 0.040%), Immigrants from Middle Africa (5.4%, a difference of 0.080%), Iroquois (5.4%, a difference of 0.080%), Tsimshian (5.4%, a difference of 0.12%), and Immigrants from South Eastern Asia (5.4%, a difference of 0.12%).
| Demographics | Rating | Rank | Female Unemployment |
| Arabs | 27.7 /100 | #193 | Fair 5.3% |
| Colombians | 27.0 /100 | #194 | Fair 5.3% |
| Immigrants | Colombia | 26.2 /100 | #195 | Fair 5.3% |
| Spaniards | 25.2 /100 | #196 | Fair 5.3% |
| Alsatians | 23.9 /100 | #197 | Fair 5.3% |
| Tsimshian | 23.1 /100 | #198 | Fair 5.4% |
| Hawaiians | 22.2 /100 | #199 | Fair 5.4% |
| Soviet Union | 21.7 /100 | #200 | Fair 5.4% |
| Immigrants | Middle Africa | 20.8 /100 | #201 | Fair 5.4% |
| Iroquois | 20.8 /100 | #202 | Fair 5.4% |
| Immigrants | South Eastern Asia | 20.3 /100 | #203 | Fair 5.4% |
| Immigrants | Israel | 19.7 /100 | #204 | Poor 5.4% |
| Immigrants | Afghanistan | 18.9 /100 | #205 | Poor 5.4% |
| Immigrants | Brazil | 18.8 /100 | #206 | Poor 5.4% |
| Creek | 15.4 /100 | #207 | Poor 5.4% |
Demographics Similar to Immigrants from Belize by Female Unemployment
In terms of female unemployment, the demographic groups most similar to Immigrants from Belize are Vietnamese (6.5%, a difference of 0.10%), Black/African American (6.5%, a difference of 0.18%), Immigrants from Dominica (6.5%, a difference of 0.72%), Immigrants from Bangladesh (6.5%, a difference of 0.73%), and British West Indian (6.4%, a difference of 0.92%).
| Demographics | Rating | Rank | Female Unemployment |
| Houma | 0.0 /100 | #316 | Tragic 6.4% |
| Immigrants | St. Vincent and the Grenadines | 0.0 /100 | #317 | Tragic 6.4% |
| British West Indians | 0.0 /100 | #318 | Tragic 6.4% |
| Immigrants | Bangladesh | 0.0 /100 | #319 | Tragic 6.5% |
| Immigrants | Dominica | 0.0 /100 | #320 | Tragic 6.5% |
| Blacks/African Americans | 0.0 /100 | #321 | Tragic 6.5% |
| Vietnamese | 0.0 /100 | #322 | Tragic 6.5% |
| Immigrants | Belize | 0.0 /100 | #323 | Tragic 6.5% |
| Cheyenne | 0.0 /100 | #324 | Tragic 6.6% |
| Apache | 0.0 /100 | #325 | Tragic 6.6% |
| Natives/Alaskans | 0.0 /100 | #326 | Tragic 6.6% |
| Alaska Natives | 0.0 /100 | #327 | Tragic 6.6% |
| Guyanese | 0.0 /100 | #328 | Tragic 6.7% |
| Immigrants | Guyana | 0.0 /100 | #329 | Tragic 6.7% |
| Yakama | 0.0 /100 | #330 | Tragic 6.7% |