Soviet Union vs Immigrants from Eastern Asia Female Unemployment
COMPARE
Soviet Union
Immigrants from Eastern Asia
Female Unemployment
Female Unemployment Comparison
Soviet Union
Immigrants from Eastern Asia
5.4%
FEMALE UNEMPLOYMENT
21.7/ 100
METRIC RATING
200th/ 347
METRIC RANK
5.1%
FEMALE UNEMPLOYMENT
83.0/ 100
METRIC RATING
139th/ 347
METRIC RANK
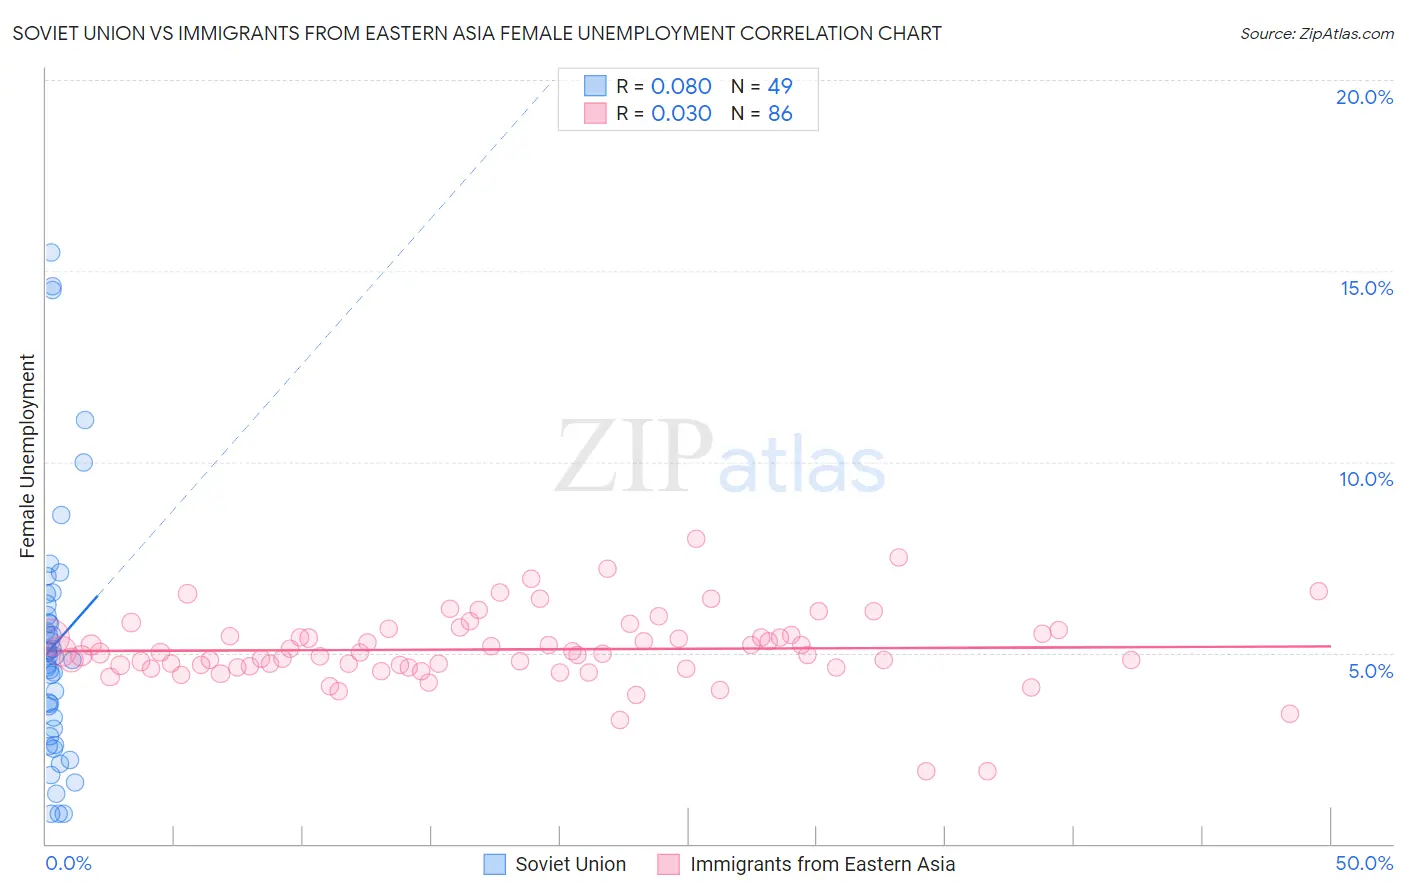
Soviet Union vs Immigrants from Eastern Asia Female Unemployment Correlation Chart
The statistical analysis conducted on geographies consisting of 43,498,217 people shows a slight positive correlation between the proportion of Soviet Union and unemploymnet rate among females in the United States with a correlation coefficient (R) of 0.080 and weighted average of 5.4%. Similarly, the statistical analysis conducted on geographies consisting of 495,373,600 people shows no correlation between the proportion of Immigrants from Eastern Asia and unemploymnet rate among females in the United States with a correlation coefficient (R) of 0.030 and weighted average of 5.1%, a difference of 4.4%.
Female Unemployment Correlation Summary
| Measurement | Soviet Union | Immigrants from Eastern Asia |
| Minimum | 0.80% | 1.9% |
| Maximum | 15.5% | 8.0% |
| Range | 14.7% | 6.1% |
| Mean | 5.2% | 5.1% |
| Median | 4.9% | 5.0% |
| Interquartile 25% (IQ1) | 2.9% | 4.6% |
| Interquartile 75% (IQ3) | 6.1% | 5.5% |
| Interquartile Range (IQR) | 3.2% | 0.85% |
| Standard Deviation (Sample) | 3.3% | 0.97% |
| Standard Deviation (Population) | 3.3% | 0.96% |
Similar Demographics by Female Unemployment
Demographics Similar to Soviet Union by Female Unemployment
In terms of female unemployment, the demographic groups most similar to Soviet Union are Hawaiian (5.4%, a difference of 0.040%), Immigrants from Middle Africa (5.4%, a difference of 0.080%), Iroquois (5.4%, a difference of 0.080%), Tsimshian (5.4%, a difference of 0.12%), and Immigrants from South Eastern Asia (5.4%, a difference of 0.12%).
| Demographics | Rating | Rank | Female Unemployment |
| Arabs | 27.7 /100 | #193 | Fair 5.3% |
| Colombians | 27.0 /100 | #194 | Fair 5.3% |
| Immigrants | Colombia | 26.2 /100 | #195 | Fair 5.3% |
| Spaniards | 25.2 /100 | #196 | Fair 5.3% |
| Alsatians | 23.9 /100 | #197 | Fair 5.3% |
| Tsimshian | 23.1 /100 | #198 | Fair 5.4% |
| Hawaiians | 22.2 /100 | #199 | Fair 5.4% |
| Soviet Union | 21.7 /100 | #200 | Fair 5.4% |
| Immigrants | Middle Africa | 20.8 /100 | #201 | Fair 5.4% |
| Iroquois | 20.8 /100 | #202 | Fair 5.4% |
| Immigrants | South Eastern Asia | 20.3 /100 | #203 | Fair 5.4% |
| Immigrants | Israel | 19.7 /100 | #204 | Poor 5.4% |
| Immigrants | Afghanistan | 18.9 /100 | #205 | Poor 5.4% |
| Immigrants | Brazil | 18.8 /100 | #206 | Poor 5.4% |
| Creek | 15.4 /100 | #207 | Poor 5.4% |
Demographics Similar to Immigrants from Eastern Asia by Female Unemployment
In terms of female unemployment, the demographic groups most similar to Immigrants from Eastern Asia are Chickasaw (5.1%, a difference of 0.020%), Immigrants from France (5.1%, a difference of 0.040%), Pakistani (5.1%, a difference of 0.080%), Indian (Asian) (5.1%, a difference of 0.13%), and Immigrants from Eastern Europe (5.1%, a difference of 0.16%).
| Demographics | Rating | Rank | Female Unemployment |
| Immigrants | Sri Lanka | 85.0 /100 | #132 | Excellent 5.1% |
| Immigrants | Hong Kong | 84.8 /100 | #133 | Excellent 5.1% |
| Immigrants | Eritrea | 84.6 /100 | #134 | Excellent 5.1% |
| Immigrants | Latvia | 84.6 /100 | #135 | Excellent 5.1% |
| Indians (Asian) | 84.2 /100 | #136 | Excellent 5.1% |
| Pakistanis | 83.8 /100 | #137 | Excellent 5.1% |
| Chickasaw | 83.2 /100 | #138 | Excellent 5.1% |
| Immigrants | Eastern Asia | 83.0 /100 | #139 | Excellent 5.1% |
| Immigrants | France | 82.7 /100 | #140 | Excellent 5.1% |
| Immigrants | Eastern Europe | 81.5 /100 | #141 | Excellent 5.1% |
| Palestinians | 80.8 /100 | #142 | Excellent 5.1% |
| Immigrants | Kazakhstan | 80.7 /100 | #143 | Excellent 5.1% |
| Immigrants | Jordan | 80.4 /100 | #144 | Excellent 5.1% |
| Immigrants | Oceania | 79.5 /100 | #145 | Good 5.2% |
| Immigrants | Norway | 79.4 /100 | #146 | Good 5.2% |