Soviet Union vs Nigerian Female Unemployment
COMPARE
Soviet Union
Nigerian
Female Unemployment
Female Unemployment Comparison
Soviet Union
Nigerians
5.4%
FEMALE UNEMPLOYMENT
21.7/ 100
METRIC RATING
200th/ 347
METRIC RANK
5.8%
FEMALE UNEMPLOYMENT
0.2/ 100
METRIC RATING
260th/ 347
METRIC RANK
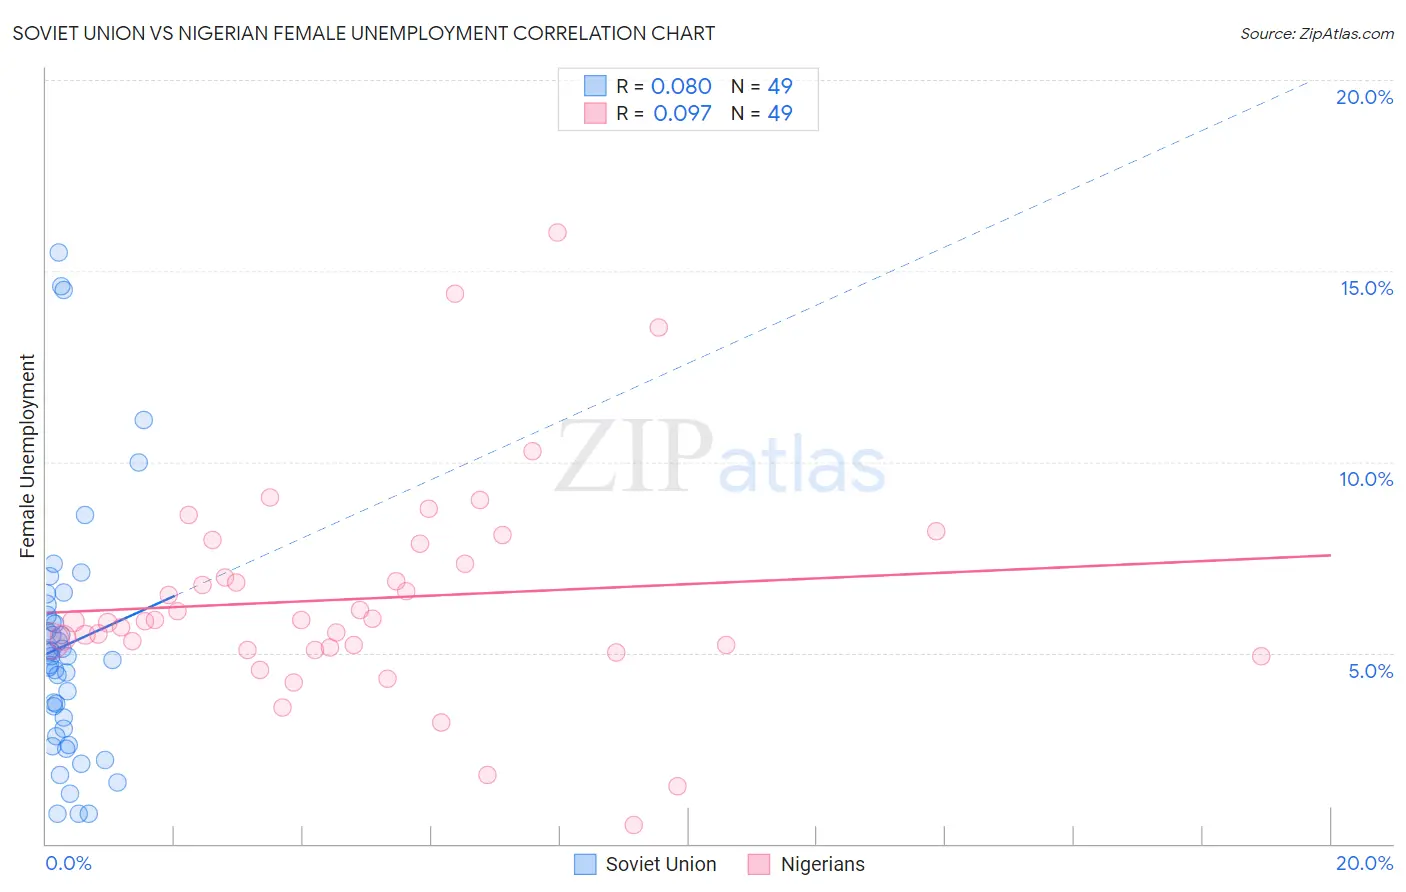
Soviet Union vs Nigerian Female Unemployment Correlation Chart
The statistical analysis conducted on geographies consisting of 43,498,217 people shows a slight positive correlation between the proportion of Soviet Union and unemploymnet rate among females in the United States with a correlation coefficient (R) of 0.080 and weighted average of 5.4%. Similarly, the statistical analysis conducted on geographies consisting of 332,062,717 people shows a slight positive correlation between the proportion of Nigerians and unemploymnet rate among females in the United States with a correlation coefficient (R) of 0.097 and weighted average of 5.8%, a difference of 7.5%.
Female Unemployment Correlation Summary
| Measurement | Soviet Union | Nigerian |
| Minimum | 0.80% | 0.50% |
| Maximum | 15.5% | 16.0% |
| Range | 14.7% | 15.5% |
| Mean | 5.2% | 6.4% |
| Median | 4.9% | 5.8% |
| Interquartile 25% (IQ1) | 2.9% | 5.1% |
| Interquartile 75% (IQ3) | 6.1% | 7.6% |
| Interquartile Range (IQR) | 3.2% | 2.5% |
| Standard Deviation (Sample) | 3.3% | 2.9% |
| Standard Deviation (Population) | 3.3% | 2.8% |
Similar Demographics by Female Unemployment
Demographics Similar to Soviet Union by Female Unemployment
In terms of female unemployment, the demographic groups most similar to Soviet Union are Hawaiian (5.4%, a difference of 0.040%), Immigrants from Middle Africa (5.4%, a difference of 0.080%), Iroquois (5.4%, a difference of 0.080%), Tsimshian (5.4%, a difference of 0.12%), and Immigrants from South Eastern Asia (5.4%, a difference of 0.12%).
| Demographics | Rating | Rank | Female Unemployment |
| Arabs | 27.7 /100 | #193 | Fair 5.3% |
| Colombians | 27.0 /100 | #194 | Fair 5.3% |
| Immigrants | Colombia | 26.2 /100 | #195 | Fair 5.3% |
| Spaniards | 25.2 /100 | #196 | Fair 5.3% |
| Alsatians | 23.9 /100 | #197 | Fair 5.3% |
| Tsimshian | 23.1 /100 | #198 | Fair 5.4% |
| Hawaiians | 22.2 /100 | #199 | Fair 5.4% |
| Soviet Union | 21.7 /100 | #200 | Fair 5.4% |
| Immigrants | Middle Africa | 20.8 /100 | #201 | Fair 5.4% |
| Iroquois | 20.8 /100 | #202 | Fair 5.4% |
| Immigrants | South Eastern Asia | 20.3 /100 | #203 | Fair 5.4% |
| Immigrants | Israel | 19.7 /100 | #204 | Poor 5.4% |
| Immigrants | Afghanistan | 18.9 /100 | #205 | Poor 5.4% |
| Immigrants | Brazil | 18.8 /100 | #206 | Poor 5.4% |
| Creek | 15.4 /100 | #207 | Poor 5.4% |
Demographics Similar to Nigerians by Female Unemployment
In terms of female unemployment, the demographic groups most similar to Nigerians are Immigrants from Fiji (5.8%, a difference of 0.040%), Immigrants from Portugal (5.8%, a difference of 0.14%), Kiowa (5.8%, a difference of 0.26%), Immigrants from Nigeria (5.8%, a difference of 0.30%), and Dutch West Indian (5.7%, a difference of 0.95%).
| Demographics | Rating | Rank | Female Unemployment |
| Immigrants | Sierra Leone | 0.6 /100 | #253 | Tragic 5.7% |
| Immigrants | Immigrants | 0.6 /100 | #254 | Tragic 5.7% |
| Immigrants | Cameroon | 0.6 /100 | #255 | Tragic 5.7% |
| Sub-Saharan Africans | 0.4 /100 | #256 | Tragic 5.7% |
| Dutch West Indians | 0.3 /100 | #257 | Tragic 5.7% |
| Immigrants | Portugal | 0.2 /100 | #258 | Tragic 5.8% |
| Immigrants | Fiji | 0.2 /100 | #259 | Tragic 5.8% |
| Nigerians | 0.2 /100 | #260 | Tragic 5.8% |
| Kiowa | 0.1 /100 | #261 | Tragic 5.8% |
| Immigrants | Nigeria | 0.1 /100 | #262 | Tragic 5.8% |
| Immigrants | Azores | 0.1 /100 | #263 | Tragic 5.8% |
| Immigrants | Bahamas | 0.1 /100 | #264 | Tragic 5.8% |
| Blackfeet | 0.0 /100 | #265 | Tragic 5.9% |
| Cape Verdeans | 0.0 /100 | #266 | Tragic 5.9% |
| Nepalese | 0.0 /100 | #267 | Tragic 5.9% |