South African vs Eastern European Unemployment Among Ages 35 to 44 years
COMPARE
South African
Eastern European
Unemployment Among Ages 35 to 44 years
Unemployment Among Ages 35 to 44 years Comparison
South Africans
Eastern Europeans
4.7%
UNEMPLOYMENT AMONG AGES 35 TO 44 YEARS
58.5/ 100
METRIC RATING
163rd/ 347
METRIC RANK
4.3%
UNEMPLOYMENT AMONG AGES 35 TO 44 YEARS
98.7/ 100
METRIC RATING
43rd/ 347
METRIC RANK
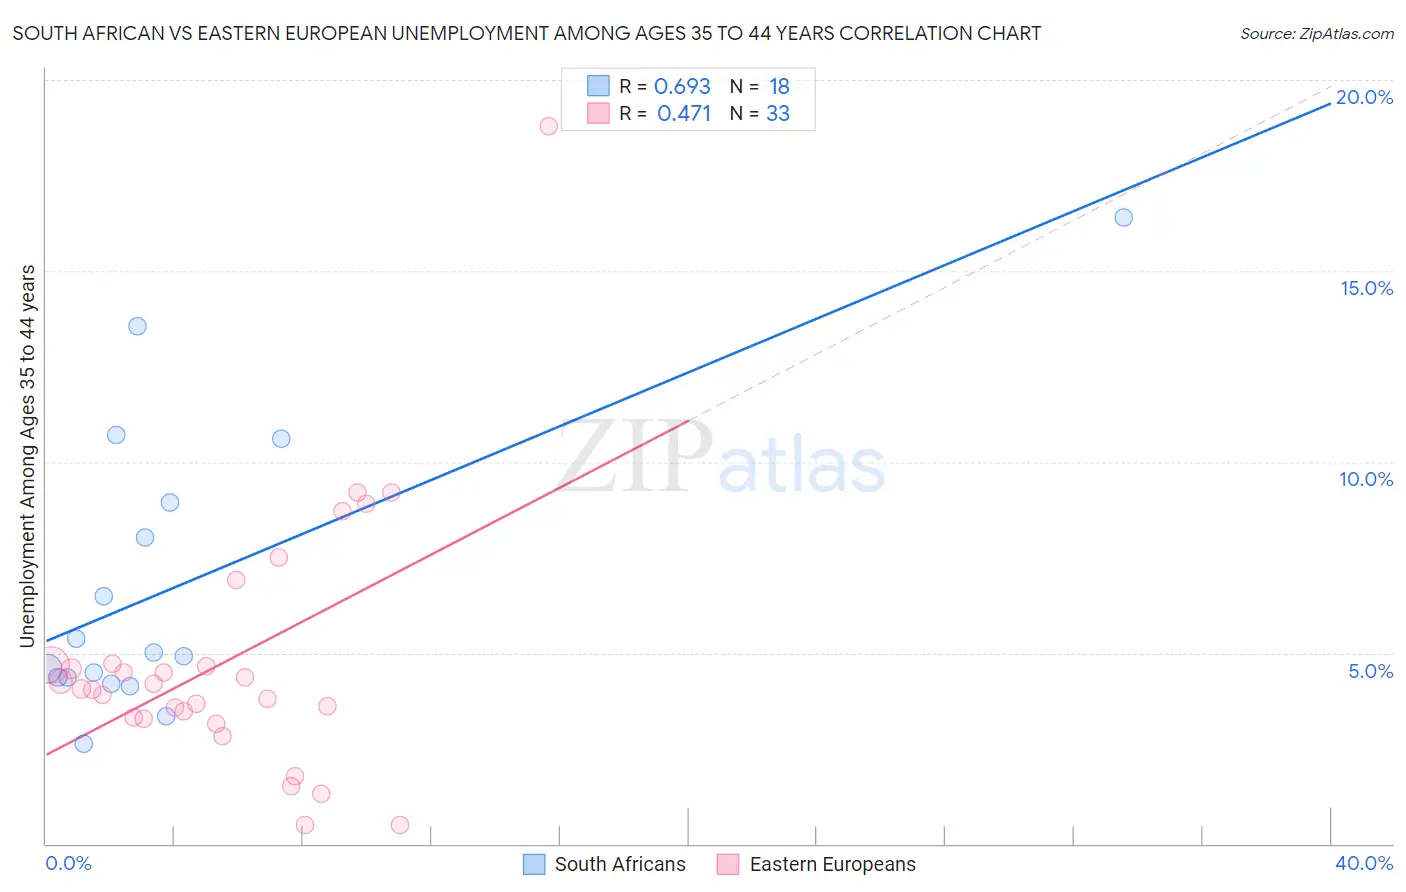
South African vs Eastern European Unemployment Among Ages 35 to 44 years Correlation Chart
The statistical analysis conducted on geographies consisting of 180,610,797 people shows a significant positive correlation between the proportion of South Africans and unemployment rate among population between the ages 35 and 44 in the United States with a correlation coefficient (R) of 0.693 and weighted average of 4.7%. Similarly, the statistical analysis conducted on geographies consisting of 443,495,673 people shows a moderate positive correlation between the proportion of Eastern Europeans and unemployment rate among population between the ages 35 and 44 in the United States with a correlation coefficient (R) of 0.471 and weighted average of 4.3%, a difference of 7.6%.
Unemployment Among Ages 35 to 44 years Correlation Summary
| Measurement | South African | Eastern European |
| Minimum | 2.6% | 0.50% |
| Maximum | 16.4% | 18.8% |
| Range | 13.8% | 18.3% |
| Mean | 6.8% | 4.8% |
| Median | 5.0% | 4.1% |
| Interquartile 25% (IQ1) | 4.4% | 3.3% |
| Interquartile 75% (IQ3) | 8.9% | 4.7% |
| Interquartile Range (IQR) | 4.6% | 1.4% |
| Standard Deviation (Sample) | 3.8% | 3.4% |
| Standard Deviation (Population) | 3.7% | 3.3% |
Similar Demographics by Unemployment Among Ages 35 to 44 years
Demographics Similar to South Africans by Unemployment Among Ages 35 to 44 years
In terms of unemployment among ages 35 to 44 years, the demographic groups most similar to South Africans are Costa Rican (4.7%, a difference of 0.080%), Immigrants from Morocco (4.7%, a difference of 0.090%), German Russian (4.7%, a difference of 0.10%), French (4.7%, a difference of 0.21%), and Celtic (4.7%, a difference of 0.23%).
| Demographics | Rating | Rank | Unemployment Among Ages 35 to 44 years |
| South Americans | 63.7 /100 | #156 | Good 4.6% |
| Immigrants | Belarus | 63.4 /100 | #157 | Good 4.6% |
| Immigrants | Iran | 63.1 /100 | #158 | Good 4.6% |
| Albanians | 63.0 /100 | #159 | Good 4.6% |
| Hungarians | 62.6 /100 | #160 | Good 4.6% |
| Celtics | 61.7 /100 | #161 | Good 4.7% |
| Costa Ricans | 59.6 /100 | #162 | Average 4.7% |
| South Africans | 58.5 /100 | #163 | Average 4.7% |
| Immigrants | Morocco | 57.2 /100 | #164 | Average 4.7% |
| German Russians | 57.2 /100 | #165 | Average 4.7% |
| French | 55.6 /100 | #166 | Average 4.7% |
| Peruvians | 54.4 /100 | #167 | Average 4.7% |
| Arabs | 53.1 /100 | #168 | Average 4.7% |
| Pennsylvania Germans | 53.0 /100 | #169 | Average 4.7% |
| Immigrants | Indonesia | 52.6 /100 | #170 | Average 4.7% |
Demographics Similar to Eastern Europeans by Unemployment Among Ages 35 to 44 years
In terms of unemployment among ages 35 to 44 years, the demographic groups most similar to Eastern Europeans are Immigrants from Malaysia (4.3%, a difference of 0.020%), German (4.3%, a difference of 0.070%), Belgian (4.3%, a difference of 0.080%), Zimbabwean (4.3%, a difference of 0.18%), and Palestinian (4.3%, a difference of 0.24%).
| Demographics | Rating | Rank | Unemployment Among Ages 35 to 44 years |
| Mongolians | 98.9 /100 | #36 | Exceptional 4.3% |
| Immigrants | Zimbabwe | 98.9 /100 | #37 | Exceptional 4.3% |
| Burmese | 98.9 /100 | #38 | Exceptional 4.3% |
| Palestinians | 98.8 /100 | #39 | Exceptional 4.3% |
| Zimbabweans | 98.8 /100 | #40 | Exceptional 4.3% |
| Belgians | 98.7 /100 | #41 | Exceptional 4.3% |
| Germans | 98.7 /100 | #42 | Exceptional 4.3% |
| Eastern Europeans | 98.7 /100 | #43 | Exceptional 4.3% |
| Immigrants | Malaysia | 98.7 /100 | #44 | Exceptional 4.3% |
| Immigrants | Korea | 98.4 /100 | #45 | Exceptional 4.3% |
| Immigrants | Belgium | 98.4 /100 | #46 | Exceptional 4.3% |
| British | 98.3 /100 | #47 | Exceptional 4.4% |
| Bhutanese | 98.2 /100 | #48 | Exceptional 4.4% |
| Swiss | 98.2 /100 | #49 | Exceptional 4.4% |
| Immigrants | Turkey | 97.8 /100 | #50 | Exceptional 4.4% |