South African vs Immigrants from Eastern Europe Unemployment Among Ages 35 to 44 years
COMPARE
South African
Immigrants from Eastern Europe
Unemployment Among Ages 35 to 44 years
Unemployment Among Ages 35 to 44 years Comparison
South Africans
Immigrants from Eastern Europe
4.7%
UNEMPLOYMENT AMONG AGES 35 TO 44 YEARS
58.5/ 100
METRIC RATING
163rd/ 347
METRIC RANK
4.6%
UNEMPLOYMENT AMONG AGES 35 TO 44 YEARS
74.7/ 100
METRIC RATING
145th/ 347
METRIC RANK
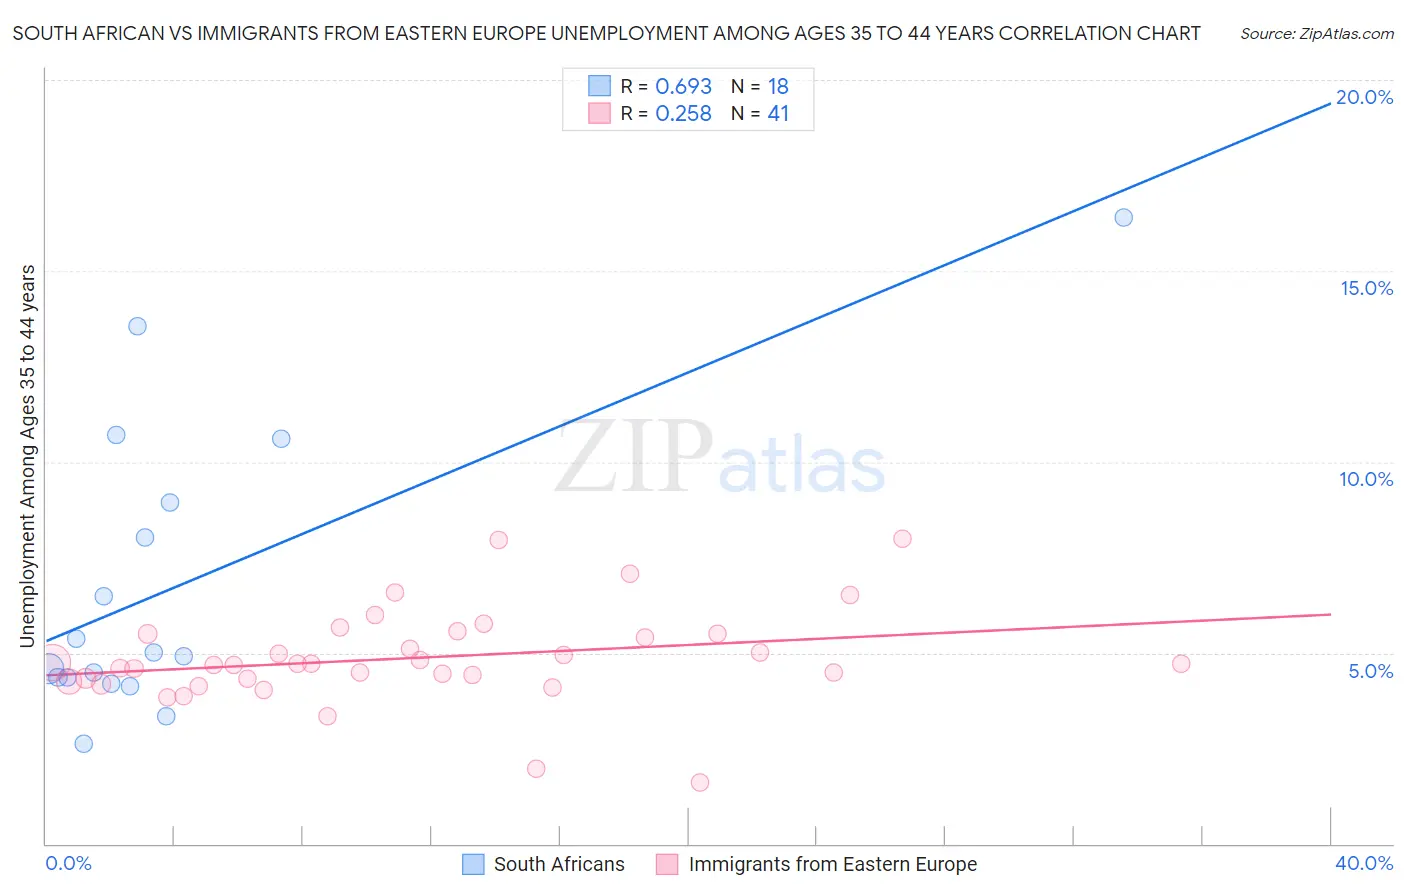
South African vs Immigrants from Eastern Europe Unemployment Among Ages 35 to 44 years Correlation Chart
The statistical analysis conducted on geographies consisting of 180,610,797 people shows a significant positive correlation between the proportion of South Africans and unemployment rate among population between the ages 35 and 44 in the United States with a correlation coefficient (R) of 0.693 and weighted average of 4.7%. Similarly, the statistical analysis conducted on geographies consisting of 458,804,175 people shows a weak positive correlation between the proportion of Immigrants from Eastern Europe and unemployment rate among population between the ages 35 and 44 in the United States with a correlation coefficient (R) of 0.258 and weighted average of 4.6%, a difference of 1.3%.
Unemployment Among Ages 35 to 44 years Correlation Summary
| Measurement | South African | Immigrants from Eastern Europe |
| Minimum | 2.6% | 1.6% |
| Maximum | 16.4% | 8.0% |
| Range | 13.8% | 6.4% |
| Mean | 6.8% | 4.9% |
| Median | 5.0% | 4.7% |
| Interquartile 25% (IQ1) | 4.4% | 4.3% |
| Interquartile 75% (IQ3) | 8.9% | 5.5% |
| Interquartile Range (IQR) | 4.6% | 1.2% |
| Standard Deviation (Sample) | 3.8% | 1.2% |
| Standard Deviation (Population) | 3.7% | 1.2% |
Demographics Similar to South Africans and Immigrants from Eastern Europe by Unemployment Among Ages 35 to 44 years
In terms of unemployment among ages 35 to 44 years, the demographic groups most similar to South Africans are Costa Rican (4.7%, a difference of 0.080%), Immigrants from Morocco (4.7%, a difference of 0.090%), Celtic (4.7%, a difference of 0.23%), Hungarian (4.6%, a difference of 0.30%), and Albanian (4.6%, a difference of 0.34%). Similarly, the demographic groups most similar to Immigrants from Eastern Europe are Immigrants from Denmark (4.6%, a difference of 0.020%), Immigrants from Russia (4.6%, a difference of 0.070%), Immigrants from Vietnam (4.6%, a difference of 0.080%), Slavic (4.6%, a difference of 0.20%), and Immigrants from Burma/Myanmar (4.6%, a difference of 0.23%).
| Demographics | Rating | Rank | Unemployment Among Ages 35 to 44 years |
| Immigrants | Russia | 75.4 /100 | #144 | Good 4.6% |
| Immigrants | Eastern Europe | 74.7 /100 | #145 | Good 4.6% |
| Immigrants | Denmark | 74.4 /100 | #146 | Good 4.6% |
| Immigrants | Vietnam | 73.8 /100 | #147 | Good 4.6% |
| Slavs | 72.4 /100 | #148 | Good 4.6% |
| Immigrants | Burma/Myanmar | 72.2 /100 | #149 | Good 4.6% |
| Immigrants | England | 70.5 /100 | #150 | Good 4.6% |
| Puget Sound Salish | 67.1 /100 | #151 | Good 4.6% |
| Pakistanis | 67.1 /100 | #152 | Good 4.6% |
| Immigrants | Brazil | 67.0 /100 | #153 | Good 4.6% |
| Immigrants | Western Europe | 65.5 /100 | #154 | Good 4.6% |
| Whites/Caucasians | 64.9 /100 | #155 | Good 4.6% |
| South Americans | 63.7 /100 | #156 | Good 4.6% |
| Immigrants | Belarus | 63.4 /100 | #157 | Good 4.6% |
| Immigrants | Iran | 63.1 /100 | #158 | Good 4.6% |
| Albanians | 63.0 /100 | #159 | Good 4.6% |
| Hungarians | 62.6 /100 | #160 | Good 4.6% |
| Celtics | 61.7 /100 | #161 | Good 4.7% |
| Costa Ricans | 59.6 /100 | #162 | Average 4.7% |
| South Africans | 58.5 /100 | #163 | Average 4.7% |
| Immigrants | Morocco | 57.2 /100 | #164 | Average 4.7% |