Alaskan Athabascan vs Eastern European Unemployment Among Ages 35 to 44 years
COMPARE
Alaskan Athabascan
Eastern European
Unemployment Among Ages 35 to 44 years
Unemployment Among Ages 35 to 44 years Comparison
Alaskan Athabascans
Eastern Europeans
8.6%
UNEMPLOYMENT AMONG AGES 35 TO 44 YEARS
0.0/ 100
METRIC RATING
340th/ 347
METRIC RANK
4.3%
UNEMPLOYMENT AMONG AGES 35 TO 44 YEARS
98.7/ 100
METRIC RATING
43rd/ 347
METRIC RANK
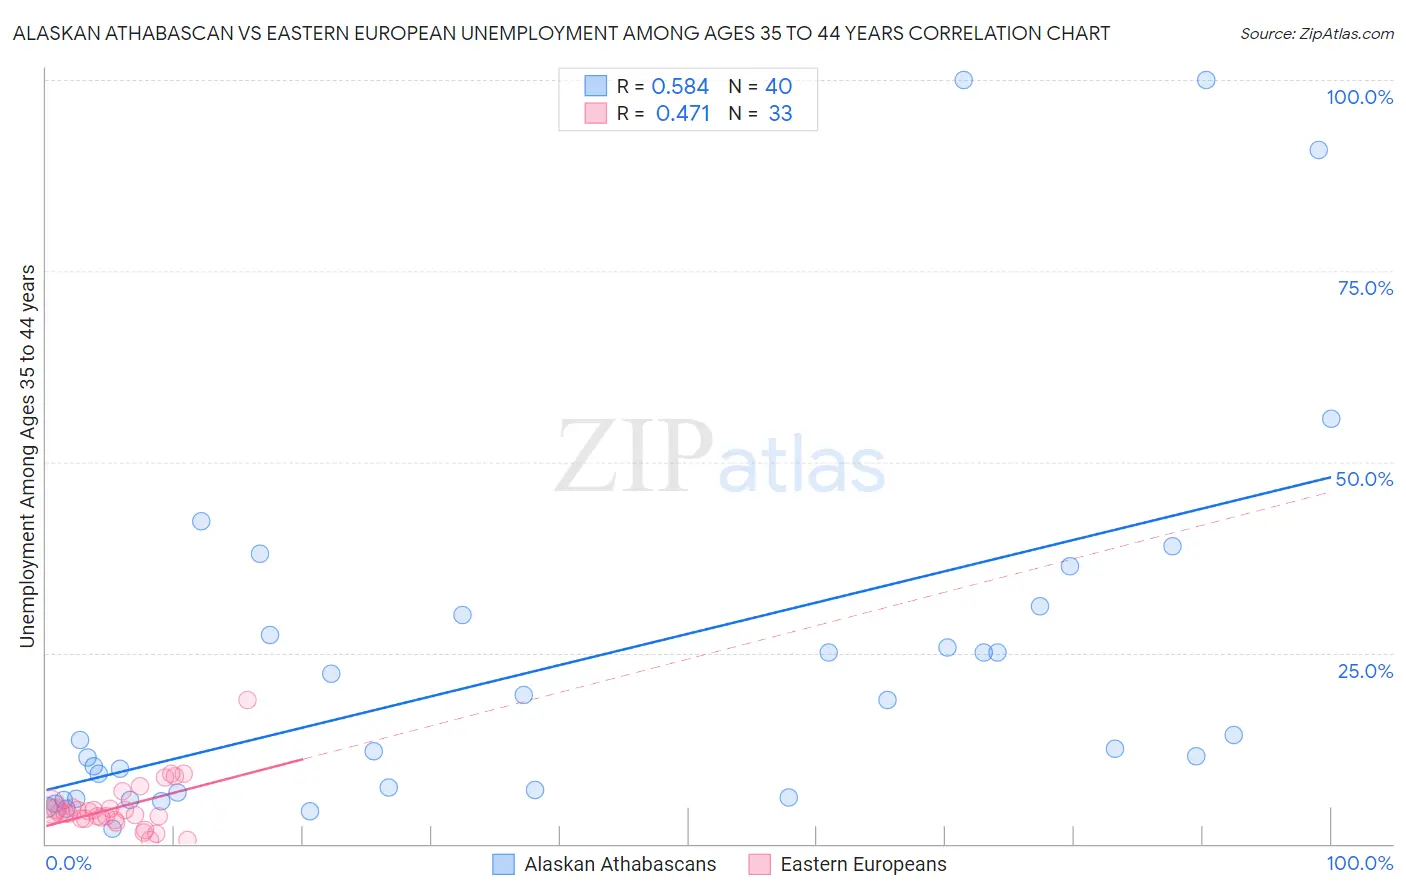
Alaskan Athabascan vs Eastern European Unemployment Among Ages 35 to 44 years Correlation Chart
The statistical analysis conducted on geographies consisting of 45,477,715 people shows a substantial positive correlation between the proportion of Alaskan Athabascans and unemployment rate among population between the ages 35 and 44 in the United States with a correlation coefficient (R) of 0.584 and weighted average of 8.6%. Similarly, the statistical analysis conducted on geographies consisting of 443,495,673 people shows a moderate positive correlation between the proportion of Eastern Europeans and unemployment rate among population between the ages 35 and 44 in the United States with a correlation coefficient (R) of 0.471 and weighted average of 4.3%, a difference of 99.2%.
Unemployment Among Ages 35 to 44 years Correlation Summary
| Measurement | Alaskan Athabascan | Eastern European |
| Minimum | 2.0% | 0.50% |
| Maximum | 100.0% | 18.8% |
| Range | 98.0% | 18.3% |
| Mean | 23.2% | 4.8% |
| Median | 13.0% | 4.1% |
| Interquartile 25% (IQ1) | 6.4% | 3.3% |
| Interquartile 75% (IQ3) | 28.7% | 4.7% |
| Interquartile Range (IQR) | 22.4% | 1.4% |
| Standard Deviation (Sample) | 24.8% | 3.4% |
| Standard Deviation (Population) | 24.5% | 3.3% |
Similar Demographics by Unemployment Among Ages 35 to 44 years
Demographics Similar to Alaskan Athabascans by Unemployment Among Ages 35 to 44 years
In terms of unemployment among ages 35 to 44 years, the demographic groups most similar to Alaskan Athabascans are Inupiat (8.6%, a difference of 0.69%), Cheyenne (8.5%, a difference of 1.8%), Tohono O'odham (8.4%, a difference of 2.3%), Apache (8.4%, a difference of 2.7%), and Hopi (8.9%, a difference of 2.9%).
| Demographics | Rating | Rank | Unemployment Among Ages 35 to 44 years |
| Puerto Ricans | 0.0 /100 | #333 | Tragic 7.6% |
| Houma | 0.0 /100 | #334 | Tragic 7.8% |
| Sioux | 0.0 /100 | #335 | Tragic 8.4% |
| Apache | 0.0 /100 | #336 | Tragic 8.4% |
| Tohono O'odham | 0.0 /100 | #337 | Tragic 8.4% |
| Cheyenne | 0.0 /100 | #338 | Tragic 8.5% |
| Inupiat | 0.0 /100 | #339 | Tragic 8.6% |
| Alaskan Athabascans | 0.0 /100 | #340 | Tragic 8.6% |
| Hopi | 0.0 /100 | #341 | Tragic 8.9% |
| Navajo | 0.0 /100 | #342 | Tragic 9.3% |
| Arapaho | 0.0 /100 | #343 | Tragic 10.3% |
| Pima | 0.0 /100 | #344 | Tragic 11.8% |
| Yup'ik | 0.0 /100 | #345 | Tragic 14.4% |
| Crow | 0.0 /100 | #346 | Tragic 15.7% |
| Yuman | 0.0 /100 | #347 | Tragic 16.9% |
Demographics Similar to Eastern Europeans by Unemployment Among Ages 35 to 44 years
In terms of unemployment among ages 35 to 44 years, the demographic groups most similar to Eastern Europeans are Immigrants from Malaysia (4.3%, a difference of 0.020%), German (4.3%, a difference of 0.070%), Belgian (4.3%, a difference of 0.080%), Zimbabwean (4.3%, a difference of 0.18%), and Palestinian (4.3%, a difference of 0.24%).
| Demographics | Rating | Rank | Unemployment Among Ages 35 to 44 years |
| Mongolians | 98.9 /100 | #36 | Exceptional 4.3% |
| Immigrants | Zimbabwe | 98.9 /100 | #37 | Exceptional 4.3% |
| Burmese | 98.9 /100 | #38 | Exceptional 4.3% |
| Palestinians | 98.8 /100 | #39 | Exceptional 4.3% |
| Zimbabweans | 98.8 /100 | #40 | Exceptional 4.3% |
| Belgians | 98.7 /100 | #41 | Exceptional 4.3% |
| Germans | 98.7 /100 | #42 | Exceptional 4.3% |
| Eastern Europeans | 98.7 /100 | #43 | Exceptional 4.3% |
| Immigrants | Malaysia | 98.7 /100 | #44 | Exceptional 4.3% |
| Immigrants | Korea | 98.4 /100 | #45 | Exceptional 4.3% |
| Immigrants | Belgium | 98.4 /100 | #46 | Exceptional 4.3% |
| British | 98.3 /100 | #47 | Exceptional 4.4% |
| Bhutanese | 98.2 /100 | #48 | Exceptional 4.4% |
| Swiss | 98.2 /100 | #49 | Exceptional 4.4% |
| Immigrants | Turkey | 97.8 /100 | #50 | Exceptional 4.4% |