South African vs Eastern European Female Unemployment
COMPARE
South African
Eastern European
Female Unemployment
Female Unemployment Comparison
South Africans
Eastern Europeans
5.2%
FEMALE UNEMPLOYMENT
70.8/ 100
METRIC RATING
154th/ 347
METRIC RANK
4.9%
FEMALE UNEMPLOYMENT
99.4/ 100
METRIC RATING
43rd/ 347
METRIC RANK
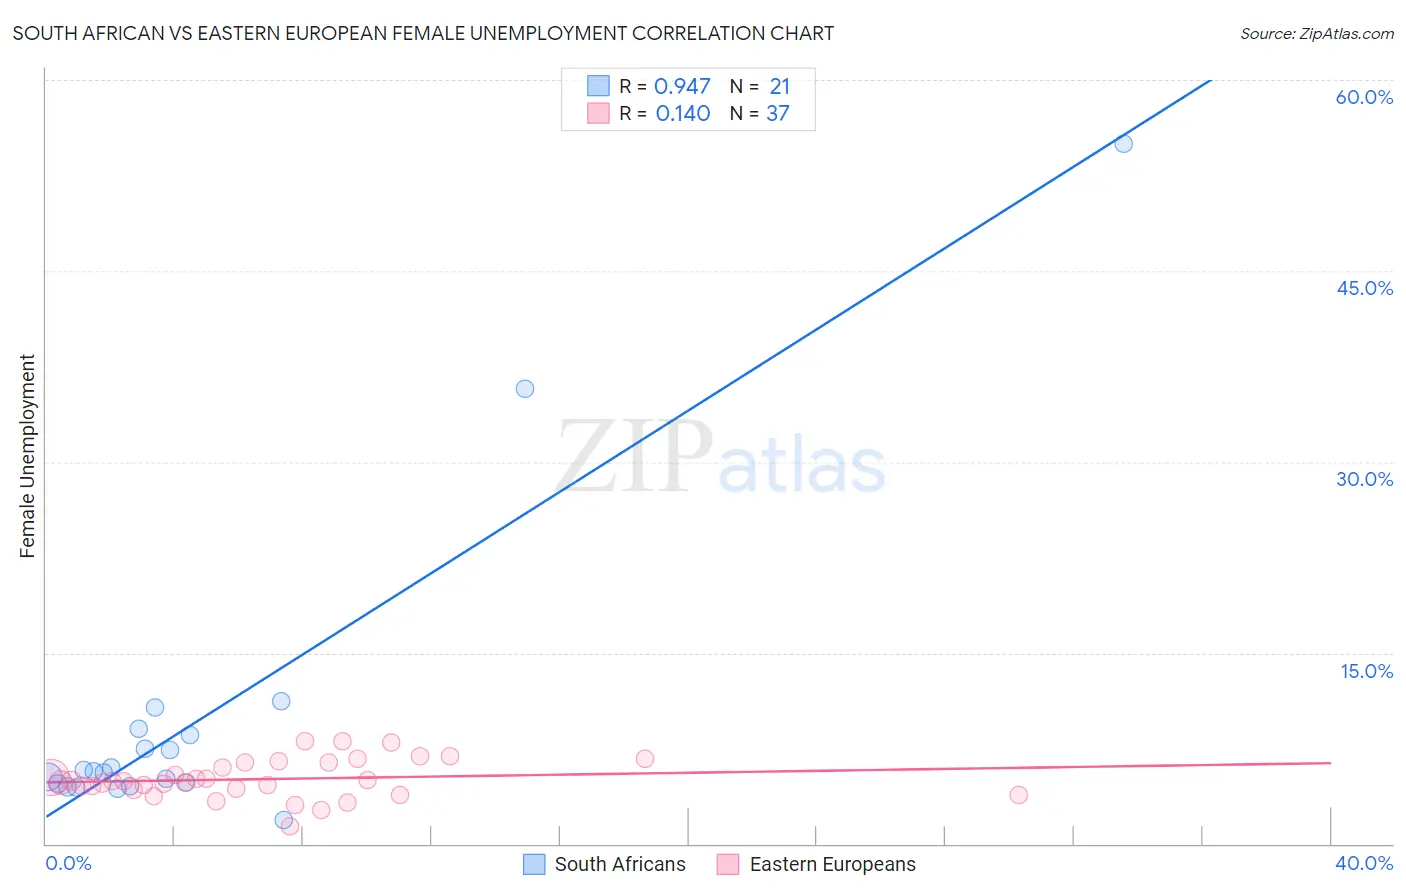
South African vs Eastern European Female Unemployment Correlation Chart
The statistical analysis conducted on geographies consisting of 182,288,157 people shows a near-perfect positive correlation between the proportion of South Africans and unemploymnet rate among females in the United States with a correlation coefficient (R) of 0.947 and weighted average of 5.2%. Similarly, the statistical analysis conducted on geographies consisting of 456,874,876 people shows a poor positive correlation between the proportion of Eastern Europeans and unemploymnet rate among females in the United States with a correlation coefficient (R) of 0.140 and weighted average of 4.9%, a difference of 6.9%.
Female Unemployment Correlation Summary
| Measurement | South African | Eastern European |
| Minimum | 1.9% | 1.4% |
| Maximum | 55.0% | 8.1% |
| Range | 53.1% | 6.7% |
| Mean | 9.9% | 5.1% |
| Median | 5.7% | 4.9% |
| Interquartile 25% (IQ1) | 4.6% | 4.3% |
| Interquartile 75% (IQ3) | 8.8% | 6.4% |
| Interquartile Range (IQR) | 4.2% | 2.1% |
| Standard Deviation (Sample) | 12.4% | 1.5% |
| Standard Deviation (Population) | 12.1% | 1.5% |
Similar Demographics by Female Unemployment
Demographics Similar to South Africans by Female Unemployment
In terms of female unemployment, the demographic groups most similar to South Africans are Immigrants from Egypt (5.2%, a difference of 0.060%), Immigrants from Northern Africa (5.2%, a difference of 0.080%), Immigrants from Russia (5.2%, a difference of 0.10%), Albanian (5.2%, a difference of 0.18%), and Immigrants from Micronesia (5.2%, a difference of 0.27%).
| Demographics | Rating | Rank | Female Unemployment |
| Argentineans | 79.2 /100 | #147 | Good 5.2% |
| Immigrants | Argentina | 78.7 /100 | #148 | Good 5.2% |
| Asians | 78.3 /100 | #149 | Good 5.2% |
| Egyptians | 78.3 /100 | #150 | Good 5.2% |
| Immigrants | China | 75.9 /100 | #151 | Good 5.2% |
| Immigrants | Italy | 75.0 /100 | #152 | Good 5.2% |
| Immigrants | Greece | 74.9 /100 | #153 | Good 5.2% |
| South Africans | 70.8 /100 | #154 | Good 5.2% |
| Immigrants | Egypt | 70.0 /100 | #155 | Good 5.2% |
| Immigrants | Northern Africa | 69.6 /100 | #156 | Good 5.2% |
| Immigrants | Russia | 69.3 /100 | #157 | Good 5.2% |
| Albanians | 68.3 /100 | #158 | Good 5.2% |
| Immigrants | Micronesia | 66.9 /100 | #159 | Good 5.2% |
| Immigrants | Spain | 66.8 /100 | #160 | Good 5.2% |
| Immigrants | Pakistan | 66.7 /100 | #161 | Good 5.2% |
Demographics Similar to Eastern Europeans by Female Unemployment
In terms of female unemployment, the demographic groups most similar to Eastern Europeans are Greek (4.9%, a difference of 0.11%), Italian (4.8%, a difference of 0.17%), Austrian (4.9%, a difference of 0.18%), Immigrants from Bulgaria (4.9%, a difference of 0.21%), and Okinawan (4.9%, a difference of 0.29%).
| Demographics | Rating | Rank | Female Unemployment |
| Yugoslavians | 99.7 /100 | #36 | Exceptional 4.8% |
| Pennsylvania Germans | 99.6 /100 | #37 | Exceptional 4.8% |
| Northern Europeans | 99.6 /100 | #38 | Exceptional 4.8% |
| Scotch-Irish | 99.6 /100 | #39 | Exceptional 4.8% |
| French | 99.6 /100 | #40 | Exceptional 4.8% |
| Tongans | 99.5 /100 | #41 | Exceptional 4.8% |
| Italians | 99.5 /100 | #42 | Exceptional 4.8% |
| Eastern Europeans | 99.4 /100 | #43 | Exceptional 4.9% |
| Greeks | 99.4 /100 | #44 | Exceptional 4.9% |
| Austrians | 99.3 /100 | #45 | Exceptional 4.9% |
| Immigrants | Bulgaria | 99.3 /100 | #46 | Exceptional 4.9% |
| Okinawans | 99.3 /100 | #47 | Exceptional 4.9% |
| Thais | 99.2 /100 | #48 | Exceptional 4.9% |
| Australians | 99.2 /100 | #49 | Exceptional 4.9% |
| Immigrants | Cuba | 99.1 /100 | #50 | Exceptional 4.9% |