Austrian vs Eastern European Unemployment Among Ages 35 to 44 years
COMPARE
Austrian
Eastern European
Unemployment Among Ages 35 to 44 years
Unemployment Among Ages 35 to 44 years Comparison
Austrians
Eastern Europeans
4.4%
UNEMPLOYMENT AMONG AGES 35 TO 44 YEARS
97.1/ 100
METRIC RATING
63rd/ 347
METRIC RANK
4.3%
UNEMPLOYMENT AMONG AGES 35 TO 44 YEARS
98.7/ 100
METRIC RATING
43rd/ 347
METRIC RANK
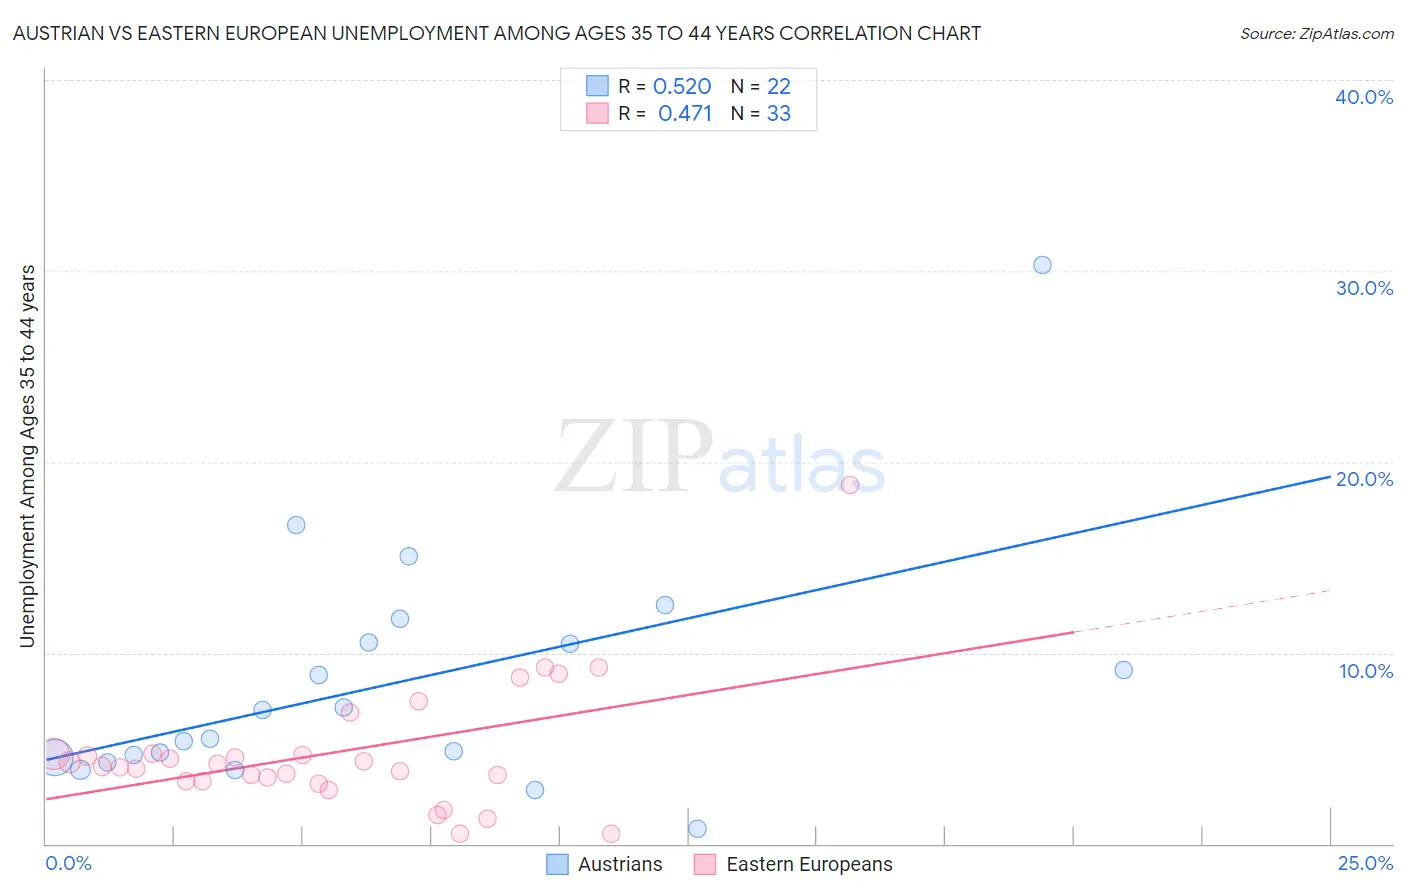
Austrian vs Eastern European Unemployment Among Ages 35 to 44 years Correlation Chart
The statistical analysis conducted on geographies consisting of 435,230,489 people shows a substantial positive correlation between the proportion of Austrians and unemployment rate among population between the ages 35 and 44 in the United States with a correlation coefficient (R) of 0.520 and weighted average of 4.4%. Similarly, the statistical analysis conducted on geographies consisting of 443,495,673 people shows a moderate positive correlation between the proportion of Eastern Europeans and unemployment rate among population between the ages 35 and 44 in the United States with a correlation coefficient (R) of 0.471 and weighted average of 4.3%, a difference of 1.5%.
Unemployment Among Ages 35 to 44 years Correlation Summary
| Measurement | Austrian | Eastern European |
| Minimum | 0.80% | 0.50% |
| Maximum | 30.3% | 18.8% |
| Range | 29.5% | 18.3% |
| Mean | 8.4% | 4.8% |
| Median | 6.2% | 4.1% |
| Interquartile 25% (IQ1) | 4.5% | 3.3% |
| Interquartile 75% (IQ3) | 10.6% | 4.7% |
| Interquartile Range (IQR) | 6.0% | 1.4% |
| Standard Deviation (Sample) | 6.4% | 3.4% |
| Standard Deviation (Population) | 6.2% | 3.3% |
Demographics Similar to Austrians and Eastern Europeans by Unemployment Among Ages 35 to 44 years
In terms of unemployment among ages 35 to 44 years, the demographic groups most similar to Austrians are Croatian (4.4%, a difference of 0.010%), Immigrants from Bulgaria (4.4%, a difference of 0.010%), Taiwanese (4.4%, a difference of 0.020%), Greek (4.4%, a difference of 0.050%), and English (4.4%, a difference of 0.060%). Similarly, the demographic groups most similar to Eastern Europeans are Immigrants from Malaysia (4.3%, a difference of 0.020%), Immigrants from Korea (4.3%, a difference of 0.34%), Immigrants from Belgium (4.3%, a difference of 0.34%), British (4.4%, a difference of 0.49%), and Bhutanese (4.4%, a difference of 0.58%).
| Demographics | Rating | Rank | Unemployment Among Ages 35 to 44 years |
| Eastern Europeans | 98.7 /100 | #43 | Exceptional 4.3% |
| Immigrants | Malaysia | 98.7 /100 | #44 | Exceptional 4.3% |
| Immigrants | Korea | 98.4 /100 | #45 | Exceptional 4.3% |
| Immigrants | Belgium | 98.4 /100 | #46 | Exceptional 4.3% |
| British | 98.3 /100 | #47 | Exceptional 4.4% |
| Bhutanese | 98.2 /100 | #48 | Exceptional 4.4% |
| Swiss | 98.2 /100 | #49 | Exceptional 4.4% |
| Immigrants | Turkey | 97.8 /100 | #50 | Exceptional 4.4% |
| Immigrants | Eastern Asia | 97.8 /100 | #51 | Exceptional 4.4% |
| Okinawans | 97.7 /100 | #52 | Exceptional 4.4% |
| Immigrants | Argentina | 97.6 /100 | #53 | Exceptional 4.4% |
| Asians | 97.4 /100 | #54 | Exceptional 4.4% |
| Immigrants | Moldova | 97.3 /100 | #55 | Exceptional 4.4% |
| Chileans | 97.3 /100 | #56 | Exceptional 4.4% |
| Immigrants | Hong Kong | 97.2 /100 | #57 | Exceptional 4.4% |
| English | 97.2 /100 | #58 | Exceptional 4.4% |
| Greeks | 97.1 /100 | #59 | Exceptional 4.4% |
| Taiwanese | 97.1 /100 | #60 | Exceptional 4.4% |
| Croatians | 97.1 /100 | #61 | Exceptional 4.4% |
| Immigrants | Bulgaria | 97.1 /100 | #62 | Exceptional 4.4% |
| Austrians | 97.1 /100 | #63 | Exceptional 4.4% |