South African vs Immigrants from Oceania Unemployment Among Ages 35 to 44 years
COMPARE
South African
Immigrants from Oceania
Unemployment Among Ages 35 to 44 years
Unemployment Among Ages 35 to 44 years Comparison
South Africans
Immigrants from Oceania
4.7%
UNEMPLOYMENT AMONG AGES 35 TO 44 YEARS
58.5/ 100
METRIC RATING
163rd/ 347
METRIC RANK
4.8%
UNEMPLOYMENT AMONG AGES 35 TO 44 YEARS
23.2/ 100
METRIC RATING
197th/ 347
METRIC RANK
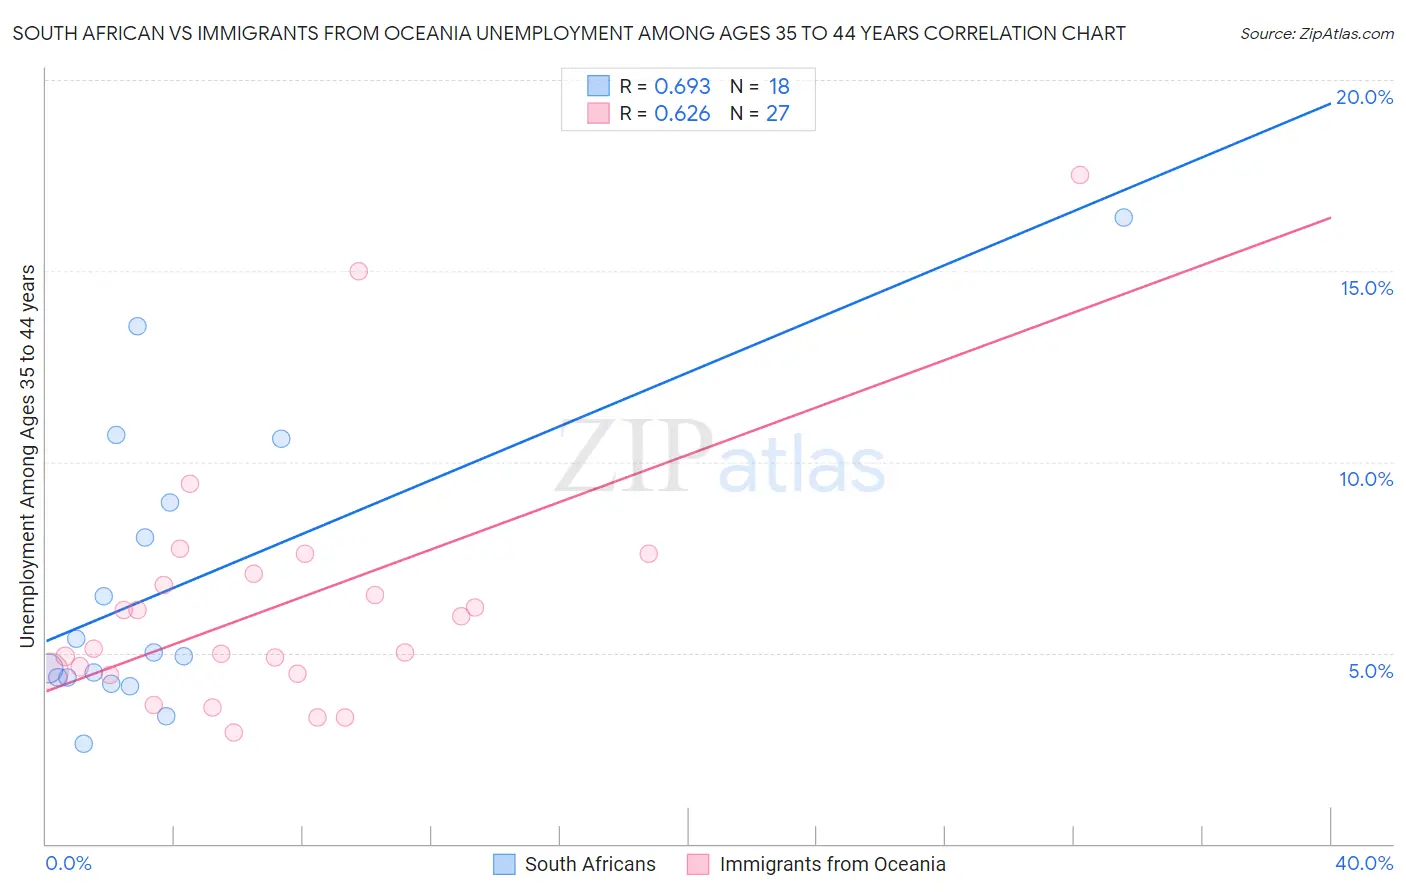
South African vs Immigrants from Oceania Unemployment Among Ages 35 to 44 years Correlation Chart
The statistical analysis conducted on geographies consisting of 180,610,797 people shows a significant positive correlation between the proportion of South Africans and unemployment rate among population between the ages 35 and 44 in the United States with a correlation coefficient (R) of 0.693 and weighted average of 4.7%. Similarly, the statistical analysis conducted on geographies consisting of 300,000,559 people shows a significant positive correlation between the proportion of Immigrants from Oceania and unemployment rate among population between the ages 35 and 44 in the United States with a correlation coefficient (R) of 0.626 and weighted average of 4.8%, a difference of 2.8%.
Unemployment Among Ages 35 to 44 years Correlation Summary
| Measurement | South African | Immigrants from Oceania |
| Minimum | 2.6% | 2.9% |
| Maximum | 16.4% | 17.5% |
| Range | 13.8% | 14.6% |
| Mean | 6.8% | 6.3% |
| Median | 5.0% | 5.1% |
| Interquartile 25% (IQ1) | 4.4% | 4.5% |
| Interquartile 75% (IQ3) | 8.9% | 7.1% |
| Interquartile Range (IQR) | 4.6% | 2.6% |
| Standard Deviation (Sample) | 3.8% | 3.3% |
| Standard Deviation (Population) | 3.7% | 3.2% |
Similar Demographics by Unemployment Among Ages 35 to 44 years
Demographics Similar to South Africans by Unemployment Among Ages 35 to 44 years
In terms of unemployment among ages 35 to 44 years, the demographic groups most similar to South Africans are Costa Rican (4.7%, a difference of 0.080%), Immigrants from Morocco (4.7%, a difference of 0.090%), German Russian (4.7%, a difference of 0.10%), French (4.7%, a difference of 0.21%), and Celtic (4.7%, a difference of 0.23%).
| Demographics | Rating | Rank | Unemployment Among Ages 35 to 44 years |
| South Americans | 63.7 /100 | #156 | Good 4.6% |
| Immigrants | Belarus | 63.4 /100 | #157 | Good 4.6% |
| Immigrants | Iran | 63.1 /100 | #158 | Good 4.6% |
| Albanians | 63.0 /100 | #159 | Good 4.6% |
| Hungarians | 62.6 /100 | #160 | Good 4.6% |
| Celtics | 61.7 /100 | #161 | Good 4.7% |
| Costa Ricans | 59.6 /100 | #162 | Average 4.7% |
| South Africans | 58.5 /100 | #163 | Average 4.7% |
| Immigrants | Morocco | 57.2 /100 | #164 | Average 4.7% |
| German Russians | 57.2 /100 | #165 | Average 4.7% |
| French | 55.6 /100 | #166 | Average 4.7% |
| Peruvians | 54.4 /100 | #167 | Average 4.7% |
| Arabs | 53.1 /100 | #168 | Average 4.7% |
| Pennsylvania Germans | 53.0 /100 | #169 | Average 4.7% |
| Immigrants | Indonesia | 52.6 /100 | #170 | Average 4.7% |
Demographics Similar to Immigrants from Oceania by Unemployment Among Ages 35 to 44 years
In terms of unemployment among ages 35 to 44 years, the demographic groups most similar to Immigrants from Oceania are Immigrants from Thailand (4.8%, a difference of 0.030%), Immigrants from Syria (4.8%, a difference of 0.040%), Immigrants from Middle Africa (4.8%, a difference of 0.13%), Immigrants from Ukraine (4.8%, a difference of 0.18%), and Ugandan (4.8%, a difference of 0.18%).
| Demographics | Rating | Rank | Unemployment Among Ages 35 to 44 years |
| Immigrants | Southern Europe | 33.8 /100 | #190 | Fair 4.7% |
| Immigrants | South America | 33.8 /100 | #191 | Fair 4.7% |
| Immigrants | Albania | 30.5 /100 | #192 | Fair 4.8% |
| Spanish | 30.4 /100 | #193 | Fair 4.8% |
| Koreans | 28.1 /100 | #194 | Fair 4.8% |
| Bangladeshis | 28.0 /100 | #195 | Fair 4.8% |
| Immigrants | Syria | 23.6 /100 | #196 | Fair 4.8% |
| Immigrants | Oceania | 23.2 /100 | #197 | Fair 4.8% |
| Immigrants | Thailand | 22.9 /100 | #198 | Fair 4.8% |
| Immigrants | Middle Africa | 21.9 /100 | #199 | Fair 4.8% |
| Immigrants | Ukraine | 21.4 /100 | #200 | Fair 4.8% |
| Ugandans | 21.4 /100 | #201 | Fair 4.8% |
| Immigrants | Afghanistan | 20.2 /100 | #202 | Fair 4.8% |
| Uruguayans | 20.0 /100 | #203 | Fair 4.8% |
| Immigrants | Philippines | 19.8 /100 | #204 | Poor 4.8% |