Immigrants from France vs Eastern European Unemployment Among Ages 35 to 44 years
COMPARE
Immigrants from France
Eastern European
Unemployment Among Ages 35 to 44 years
Unemployment Among Ages 35 to 44 years Comparison
Immigrants from France
Eastern Europeans
4.5%
UNEMPLOYMENT AMONG AGES 35 TO 44 YEARS
92.5/ 100
METRIC RATING
97th/ 347
METRIC RANK
4.3%
UNEMPLOYMENT AMONG AGES 35 TO 44 YEARS
98.7/ 100
METRIC RATING
43rd/ 347
METRIC RANK
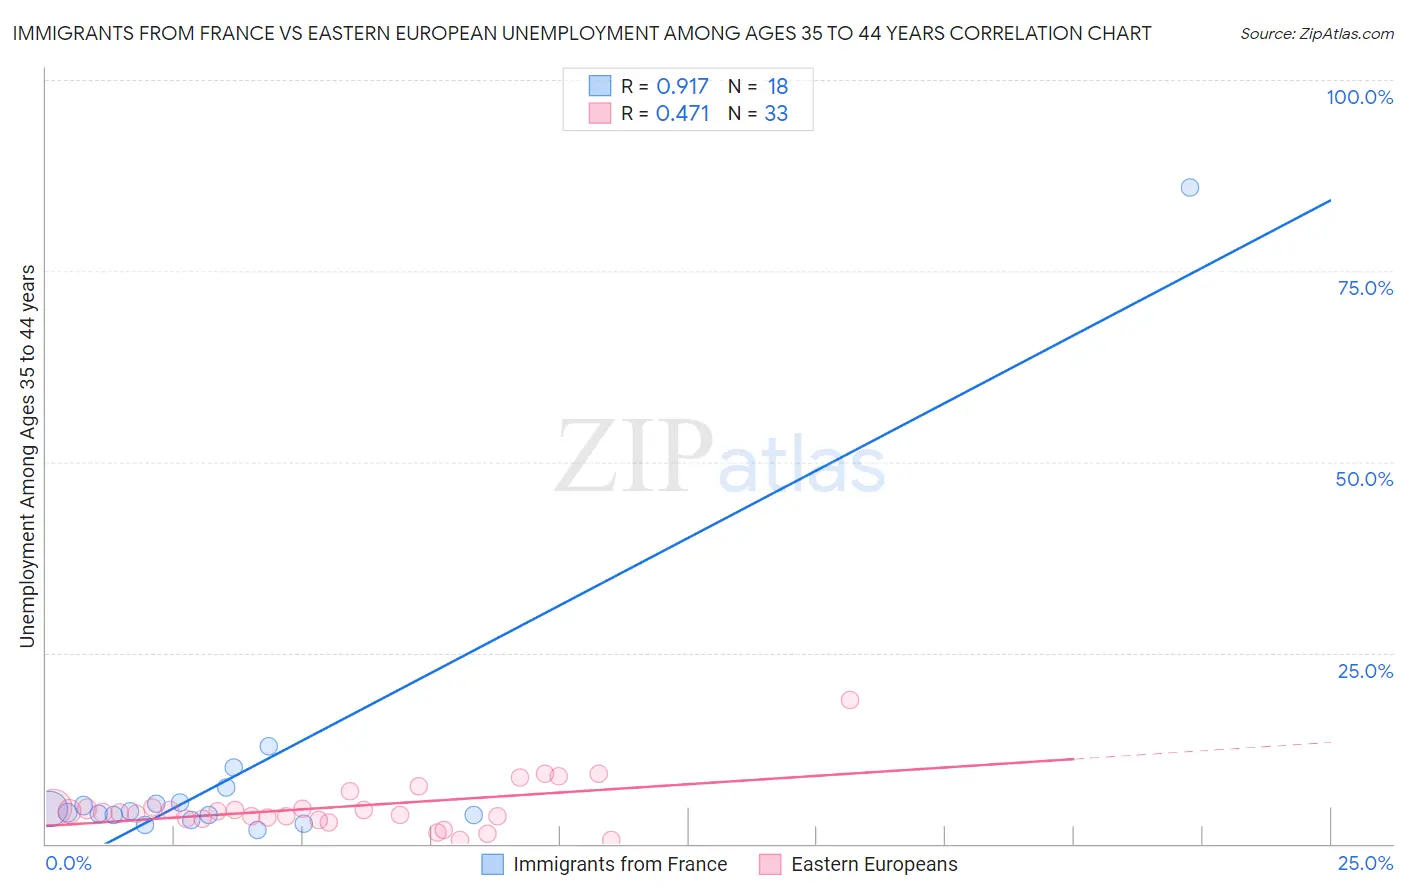
Immigrants from France vs Eastern European Unemployment Among Ages 35 to 44 years Correlation Chart
The statistical analysis conducted on geographies consisting of 283,330,530 people shows a near-perfect positive correlation between the proportion of Immigrants from France and unemployment rate among population between the ages 35 and 44 in the United States with a correlation coefficient (R) of 0.917 and weighted average of 4.5%. Similarly, the statistical analysis conducted on geographies consisting of 443,495,673 people shows a moderate positive correlation between the proportion of Eastern Europeans and unemployment rate among population between the ages 35 and 44 in the United States with a correlation coefficient (R) of 0.471 and weighted average of 4.3%, a difference of 3.4%.
Unemployment Among Ages 35 to 44 years Correlation Summary
| Measurement | Immigrants from France | Eastern European |
| Minimum | 1.8% | 0.50% |
| Maximum | 86.0% | 18.8% |
| Range | 84.2% | 18.3% |
| Mean | 9.4% | 4.8% |
| Median | 4.2% | 4.1% |
| Interquartile 25% (IQ1) | 3.8% | 3.3% |
| Interquartile 75% (IQ3) | 5.4% | 4.7% |
| Interquartile Range (IQR) | 1.7% | 1.4% |
| Standard Deviation (Sample) | 19.3% | 3.4% |
| Standard Deviation (Population) | 18.8% | 3.3% |
Similar Demographics by Unemployment Among Ages 35 to 44 years
Demographics Similar to Immigrants from France by Unemployment Among Ages 35 to 44 years
In terms of unemployment among ages 35 to 44 years, the demographic groups most similar to Immigrants from France are Immigrants from Canada (4.5%, a difference of 0.050%), Immigrants from Egypt (4.5%, a difference of 0.060%), Italian (4.5%, a difference of 0.15%), Immigrants from Netherlands (4.5%, a difference of 0.16%), and Immigrants from Sudan (4.5%, a difference of 0.19%).
| Demographics | Rating | Rank | Unemployment Among Ages 35 to 44 years |
| Australians | 94.5 /100 | #90 | Exceptional 4.5% |
| Immigrants | Northern Europe | 94.3 /100 | #91 | Exceptional 4.5% |
| Estonians | 94.3 /100 | #92 | Exceptional 4.5% |
| Iranians | 93.9 /100 | #93 | Exceptional 4.5% |
| Russians | 93.8 /100 | #94 | Exceptional 4.5% |
| Yugoslavians | 93.6 /100 | #95 | Exceptional 4.5% |
| Scottish | 93.5 /100 | #96 | Exceptional 4.5% |
| Immigrants | France | 92.5 /100 | #97 | Exceptional 4.5% |
| Immigrants | Canada | 92.3 /100 | #98 | Exceptional 4.5% |
| Immigrants | Egypt | 92.3 /100 | #99 | Exceptional 4.5% |
| Italians | 91.9 /100 | #100 | Exceptional 4.5% |
| Immigrants | Netherlands | 91.9 /100 | #101 | Exceptional 4.5% |
| Immigrants | Sudan | 91.8 /100 | #102 | Exceptional 4.5% |
| Welsh | 91.6 /100 | #103 | Exceptional 4.5% |
| Finns | 91.6 /100 | #104 | Exceptional 4.5% |
Demographics Similar to Eastern Europeans by Unemployment Among Ages 35 to 44 years
In terms of unemployment among ages 35 to 44 years, the demographic groups most similar to Eastern Europeans are Immigrants from Malaysia (4.3%, a difference of 0.020%), German (4.3%, a difference of 0.070%), Belgian (4.3%, a difference of 0.080%), Zimbabwean (4.3%, a difference of 0.18%), and Palestinian (4.3%, a difference of 0.24%).
| Demographics | Rating | Rank | Unemployment Among Ages 35 to 44 years |
| Mongolians | 98.9 /100 | #36 | Exceptional 4.3% |
| Immigrants | Zimbabwe | 98.9 /100 | #37 | Exceptional 4.3% |
| Burmese | 98.9 /100 | #38 | Exceptional 4.3% |
| Palestinians | 98.8 /100 | #39 | Exceptional 4.3% |
| Zimbabweans | 98.8 /100 | #40 | Exceptional 4.3% |
| Belgians | 98.7 /100 | #41 | Exceptional 4.3% |
| Germans | 98.7 /100 | #42 | Exceptional 4.3% |
| Eastern Europeans | 98.7 /100 | #43 | Exceptional 4.3% |
| Immigrants | Malaysia | 98.7 /100 | #44 | Exceptional 4.3% |
| Immigrants | Korea | 98.4 /100 | #45 | Exceptional 4.3% |
| Immigrants | Belgium | 98.4 /100 | #46 | Exceptional 4.3% |
| British | 98.3 /100 | #47 | Exceptional 4.4% |
| Bhutanese | 98.2 /100 | #48 | Exceptional 4.4% |
| Swiss | 98.2 /100 | #49 | Exceptional 4.4% |
| Immigrants | Turkey | 97.8 /100 | #50 | Exceptional 4.4% |