Slovene vs Puerto Rican Unemployment
COMPARE
Slovene
Puerto Rican
Unemployment
Unemployment Comparison
Slovenes
Puerto Ricans
4.7%
UNEMPLOYMENT
99.9/ 100
METRIC RATING
17th/ 347
METRIC RANK
8.4%
UNEMPLOYMENT
0.0/ 100
METRIC RATING
340th/ 347
METRIC RANK
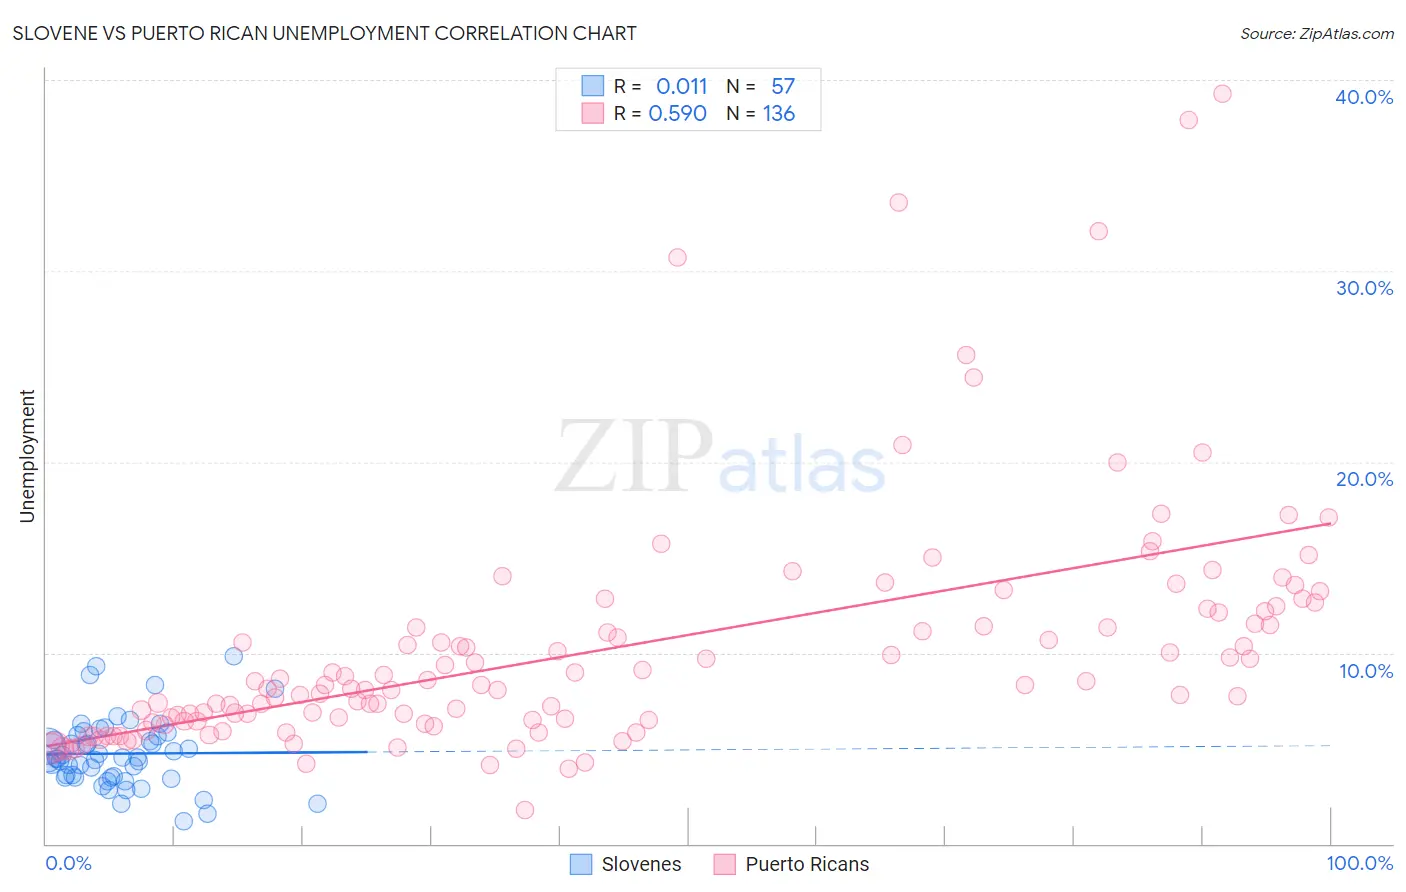
Slovene vs Puerto Rican Unemployment Correlation Chart
The statistical analysis conducted on geographies consisting of 261,132,264 people shows no correlation between the proportion of Slovenes and unemployment in the United States with a correlation coefficient (R) of 0.011 and weighted average of 4.7%. Similarly, the statistical analysis conducted on geographies consisting of 526,845,718 people shows a substantial positive correlation between the proportion of Puerto Ricans and unemployment in the United States with a correlation coefficient (R) of 0.590 and weighted average of 8.4%, a difference of 80.8%.
Unemployment Correlation Summary
| Measurement | Slovene | Puerto Rican |
| Minimum | 1.2% | 1.8% |
| Maximum | 9.8% | 39.3% |
| Range | 8.6% | 37.5% |
| Mean | 4.7% | 10.2% |
| Median | 4.5% | 8.3% |
| Interquartile 25% (IQ1) | 3.5% | 6.4% |
| Interquartile 75% (IQ3) | 5.7% | 11.8% |
| Interquartile Range (IQR) | 2.2% | 5.4% |
| Standard Deviation (Sample) | 1.8% | 6.3% |
| Standard Deviation (Population) | 1.8% | 6.3% |
Similar Demographics by Unemployment
Demographics Similar to Slovenes by Unemployment
In terms of unemployment, the demographic groups most similar to Slovenes are Immigrants from Venezuela (4.7%, a difference of 0.020%), Chinese (4.7%, a difference of 0.10%), Scottish (4.7%, a difference of 0.10%), European (4.6%, a difference of 0.24%), and Carpatho Rusyn (4.7%, a difference of 0.69%).
| Demographics | Rating | Rank | Unemployment |
| Dutch | 100.0 /100 | #10 | Exceptional 4.6% |
| English | 100.0 /100 | #11 | Exceptional 4.6% |
| Pennsylvania Germans | 100.0 /100 | #12 | Exceptional 4.6% |
| Belgians | 100.0 /100 | #13 | Exceptional 4.6% |
| Immigrants | Cuba | 100.0 /100 | #14 | Exceptional 4.6% |
| Europeans | 99.9 /100 | #15 | Exceptional 4.6% |
| Chinese | 99.9 /100 | #16 | Exceptional 4.7% |
| Slovenes | 99.9 /100 | #17 | Exceptional 4.7% |
| Immigrants | Venezuela | 99.9 /100 | #18 | Exceptional 4.7% |
| Scottish | 99.9 /100 | #19 | Exceptional 4.7% |
| Carpatho Rusyns | 99.9 /100 | #20 | Exceptional 4.7% |
| Welsh | 99.9 /100 | #21 | Exceptional 4.7% |
| Thais | 99.9 /100 | #22 | Exceptional 4.7% |
| British | 99.9 /100 | #23 | Exceptional 4.7% |
| Venezuelans | 99.9 /100 | #24 | Exceptional 4.7% |
Demographics Similar to Puerto Ricans by Unemployment
In terms of unemployment, the demographic groups most similar to Puerto Ricans are Navajo (8.4%, a difference of 0.79%), Pima (8.2%, a difference of 2.4%), Cheyenne (8.0%, a difference of 5.2%), Tohono O'odham (8.9%, a difference of 5.4%), and Hopi (8.9%, a difference of 5.9%).
| Demographics | Rating | Rank | Unemployment |
| Immigrants | Dominican Republic | 0.0 /100 | #333 | Tragic 7.4% |
| Apache | 0.0 /100 | #334 | Tragic 7.4% |
| Alaskan Athabascans | 0.0 /100 | #335 | Tragic 7.7% |
| Immigrants | Yemen | 0.0 /100 | #336 | Tragic 7.7% |
| Cheyenne | 0.0 /100 | #337 | Tragic 8.0% |
| Pima | 0.0 /100 | #338 | Tragic 8.2% |
| Navajo | 0.0 /100 | #339 | Tragic 8.4% |
| Puerto Ricans | 0.0 /100 | #340 | Tragic 8.4% |
| Tohono O'odham | 0.0 /100 | #341 | Tragic 8.9% |
| Hopi | 0.0 /100 | #342 | Tragic 8.9% |
| Yuman | 0.0 /100 | #343 | Tragic 9.1% |
| Arapaho | 0.0 /100 | #344 | Tragic 9.8% |
| Inupiat | 0.0 /100 | #345 | Tragic 10.1% |
| Crow | 0.0 /100 | #346 | Tragic 11.1% |
| Yup'ik | 0.0 /100 | #347 | Tragic 13.6% |