Slovene vs Immigrants from Kuwait Unemployment
COMPARE
Slovene
Immigrants from Kuwait
Unemployment
Unemployment Comparison
Slovenes
Immigrants from Kuwait
4.7%
UNEMPLOYMENT
99.9/ 100
METRIC RATING
17th/ 347
METRIC RANK
5.0%
UNEMPLOYMENT
93.7/ 100
METRIC RATING
108th/ 347
METRIC RANK
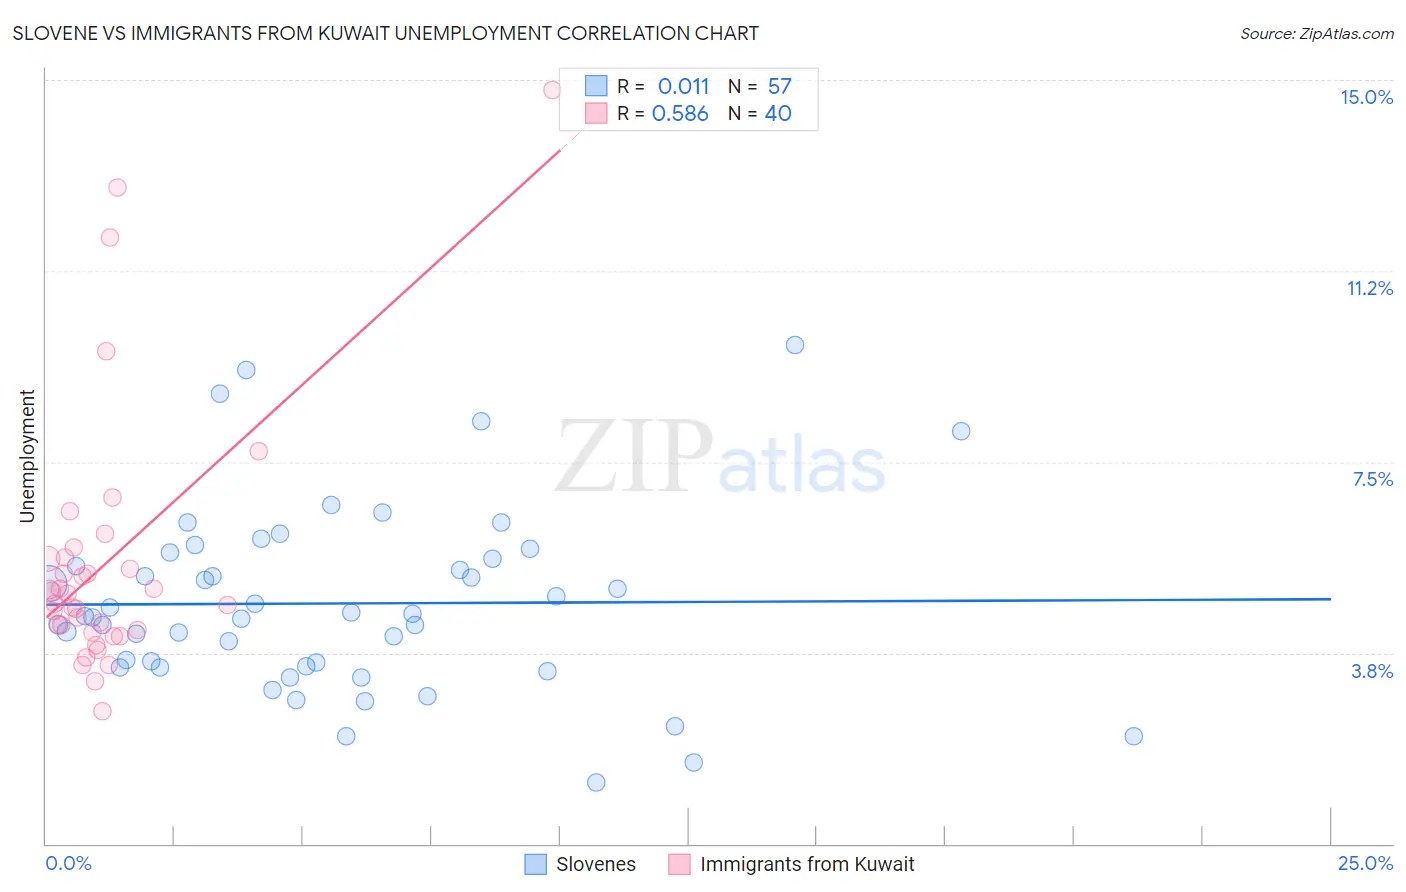
Slovene vs Immigrants from Kuwait Unemployment Correlation Chart
The statistical analysis conducted on geographies consisting of 261,132,264 people shows no correlation between the proportion of Slovenes and unemployment in the United States with a correlation coefficient (R) of 0.011 and weighted average of 4.7%. Similarly, the statistical analysis conducted on geographies consisting of 136,907,851 people shows a substantial positive correlation between the proportion of Immigrants from Kuwait and unemployment in the United States with a correlation coefficient (R) of 0.586 and weighted average of 5.0%, a difference of 8.2%.
Unemployment Correlation Summary
| Measurement | Slovene | Immigrants from Kuwait |
| Minimum | 1.2% | 2.6% |
| Maximum | 9.8% | 14.8% |
| Range | 8.6% | 12.2% |
| Mean | 4.7% | 5.5% |
| Median | 4.5% | 4.8% |
| Interquartile 25% (IQ1) | 3.5% | 4.2% |
| Interquartile 75% (IQ3) | 5.7% | 5.6% |
| Interquartile Range (IQR) | 2.2% | 1.4% |
| Standard Deviation (Sample) | 1.8% | 2.6% |
| Standard Deviation (Population) | 1.8% | 2.5% |
Similar Demographics by Unemployment
Demographics Similar to Slovenes by Unemployment
In terms of unemployment, the demographic groups most similar to Slovenes are Immigrants from Venezuela (4.7%, a difference of 0.020%), Chinese (4.7%, a difference of 0.10%), Scottish (4.7%, a difference of 0.10%), European (4.6%, a difference of 0.24%), and Carpatho Rusyn (4.7%, a difference of 0.69%).
| Demographics | Rating | Rank | Unemployment |
| Dutch | 100.0 /100 | #10 | Exceptional 4.6% |
| English | 100.0 /100 | #11 | Exceptional 4.6% |
| Pennsylvania Germans | 100.0 /100 | #12 | Exceptional 4.6% |
| Belgians | 100.0 /100 | #13 | Exceptional 4.6% |
| Immigrants | Cuba | 100.0 /100 | #14 | Exceptional 4.6% |
| Europeans | 99.9 /100 | #15 | Exceptional 4.6% |
| Chinese | 99.9 /100 | #16 | Exceptional 4.7% |
| Slovenes | 99.9 /100 | #17 | Exceptional 4.7% |
| Immigrants | Venezuela | 99.9 /100 | #18 | Exceptional 4.7% |
| Scottish | 99.9 /100 | #19 | Exceptional 4.7% |
| Carpatho Rusyns | 99.9 /100 | #20 | Exceptional 4.7% |
| Welsh | 99.9 /100 | #21 | Exceptional 4.7% |
| Thais | 99.9 /100 | #22 | Exceptional 4.7% |
| British | 99.9 /100 | #23 | Exceptional 4.7% |
| Venezuelans | 99.9 /100 | #24 | Exceptional 4.7% |
Demographics Similar to Immigrants from Kuwait by Unemployment
In terms of unemployment, the demographic groups most similar to Immigrants from Kuwait are Immigrants from Turkey (5.0%, a difference of 0.010%), Immigrants from Romania (5.0%, a difference of 0.020%), Chickasaw (5.0%, a difference of 0.080%), Osage (5.0%, a difference of 0.080%), and Maltese (5.0%, a difference of 0.080%).
| Demographics | Rating | Rank | Unemployment |
| Americans | 94.3 /100 | #101 | Exceptional 5.0% |
| Immigrants | Argentina | 94.1 /100 | #102 | Exceptional 5.0% |
| Chickasaw | 94.0 /100 | #103 | Exceptional 5.0% |
| Osage | 94.0 /100 | #104 | Exceptional 5.0% |
| Maltese | 94.0 /100 | #105 | Exceptional 5.0% |
| Immigrants | Romania | 93.7 /100 | #106 | Exceptional 5.0% |
| Immigrants | Turkey | 93.7 /100 | #107 | Exceptional 5.0% |
| Immigrants | Kuwait | 93.7 /100 | #108 | Exceptional 5.0% |
| Immigrants | Eritrea | 93.3 /100 | #109 | Exceptional 5.0% |
| Immigrants | Lithuania | 93.2 /100 | #110 | Exceptional 5.0% |
| Chileans | 93.2 /100 | #111 | Exceptional 5.0% |
| South Africans | 92.6 /100 | #112 | Exceptional 5.1% |
| Argentineans | 92.4 /100 | #113 | Exceptional 5.1% |
| Immigrants | Ireland | 92.1 /100 | #114 | Exceptional 5.1% |
| Immigrants | Western Europe | 91.1 /100 | #115 | Exceptional 5.1% |