Slovene vs Salvadoran Unemployment
COMPARE
Slovene
Salvadoran
Unemployment
Unemployment Comparison
Slovenes
Salvadorans
4.7%
UNEMPLOYMENT
99.9/ 100
METRIC RATING
17th/ 347
METRIC RANK
5.8%
UNEMPLOYMENT
0.1/ 100
METRIC RATING
263rd/ 347
METRIC RANK
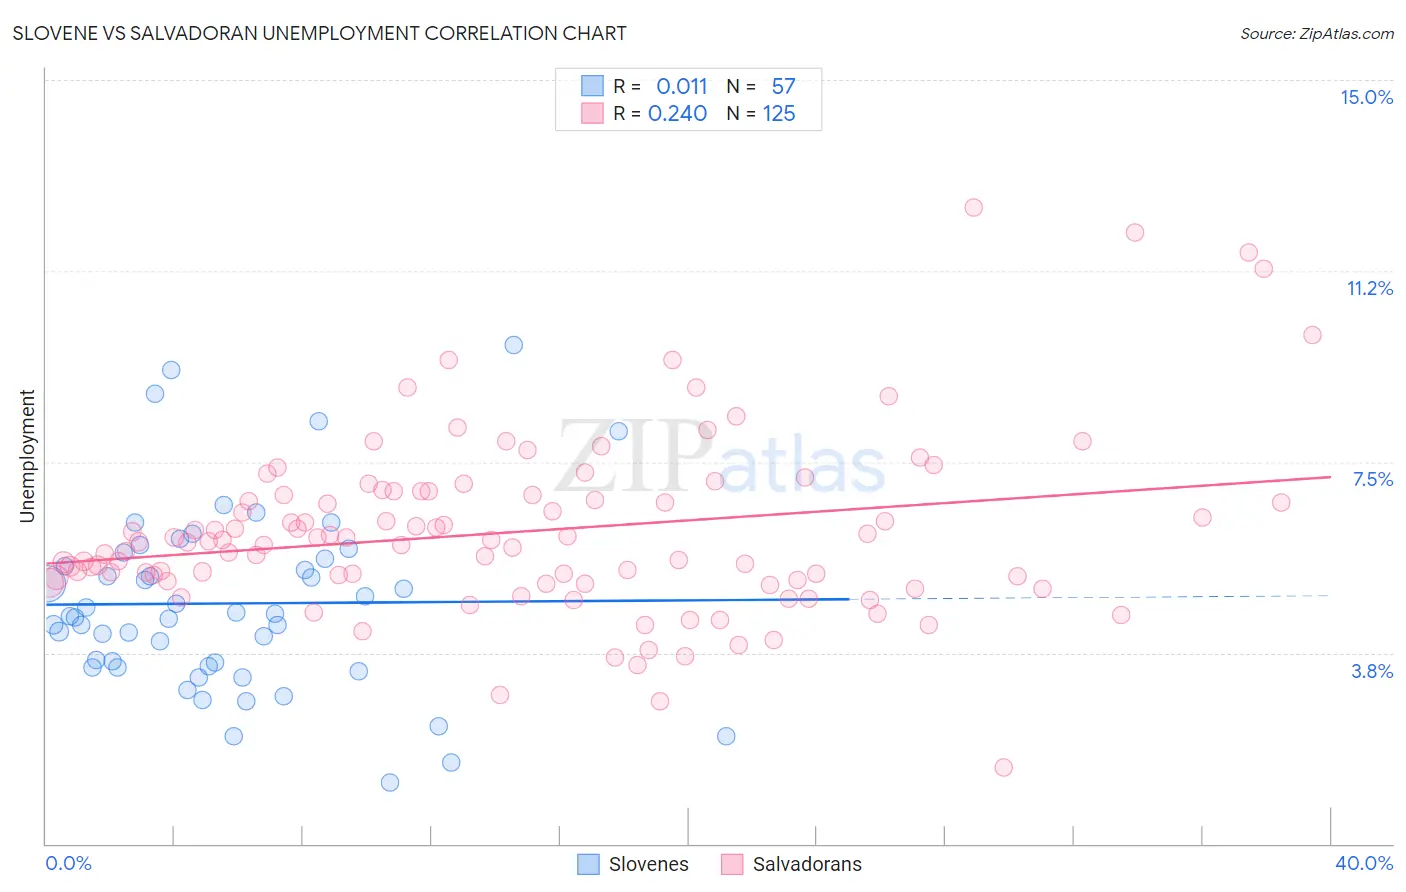
Slovene vs Salvadoran Unemployment Correlation Chart
The statistical analysis conducted on geographies consisting of 261,132,264 people shows no correlation between the proportion of Slovenes and unemployment in the United States with a correlation coefficient (R) of 0.011 and weighted average of 4.7%. Similarly, the statistical analysis conducted on geographies consisting of 398,590,772 people shows a weak positive correlation between the proportion of Salvadorans and unemployment in the United States with a correlation coefficient (R) of 0.240 and weighted average of 5.8%, a difference of 24.6%.
Unemployment Correlation Summary
| Measurement | Slovene | Salvadoran |
| Minimum | 1.2% | 1.5% |
| Maximum | 9.8% | 12.5% |
| Range | 8.6% | 11.0% |
| Mean | 4.7% | 6.1% |
| Median | 4.5% | 5.9% |
| Interquartile 25% (IQ1) | 3.5% | 5.2% |
| Interquartile 75% (IQ3) | 5.7% | 6.9% |
| Interquartile Range (IQR) | 2.2% | 1.7% |
| Standard Deviation (Sample) | 1.8% | 1.7% |
| Standard Deviation (Population) | 1.8% | 1.7% |
Similar Demographics by Unemployment
Demographics Similar to Slovenes by Unemployment
In terms of unemployment, the demographic groups most similar to Slovenes are Immigrants from Venezuela (4.7%, a difference of 0.020%), Chinese (4.7%, a difference of 0.10%), Scottish (4.7%, a difference of 0.10%), European (4.6%, a difference of 0.24%), and Carpatho Rusyn (4.7%, a difference of 0.69%).
| Demographics | Rating | Rank | Unemployment |
| Dutch | 100.0 /100 | #10 | Exceptional 4.6% |
| English | 100.0 /100 | #11 | Exceptional 4.6% |
| Pennsylvania Germans | 100.0 /100 | #12 | Exceptional 4.6% |
| Belgians | 100.0 /100 | #13 | Exceptional 4.6% |
| Immigrants | Cuba | 100.0 /100 | #14 | Exceptional 4.6% |
| Europeans | 99.9 /100 | #15 | Exceptional 4.6% |
| Chinese | 99.9 /100 | #16 | Exceptional 4.7% |
| Slovenes | 99.9 /100 | #17 | Exceptional 4.7% |
| Immigrants | Venezuela | 99.9 /100 | #18 | Exceptional 4.7% |
| Scottish | 99.9 /100 | #19 | Exceptional 4.7% |
| Carpatho Rusyns | 99.9 /100 | #20 | Exceptional 4.7% |
| Welsh | 99.9 /100 | #21 | Exceptional 4.7% |
| Thais | 99.9 /100 | #22 | Exceptional 4.7% |
| British | 99.9 /100 | #23 | Exceptional 4.7% |
| Venezuelans | 99.9 /100 | #24 | Exceptional 4.7% |
Demographics Similar to Salvadorans by Unemployment
In terms of unemployment, the demographic groups most similar to Salvadorans are Sierra Leonean (5.8%, a difference of 0.030%), Immigrants from Liberia (5.8%, a difference of 0.090%), Immigrants from Guatemala (5.8%, a difference of 0.13%), Immigrants from Uzbekistan (5.8%, a difference of 0.15%), and Nigerian (5.8%, a difference of 0.16%).
| Demographics | Rating | Rank | Unemployment |
| Guatemalans | 0.2 /100 | #256 | Tragic 5.8% |
| Yaqui | 0.2 /100 | #257 | Tragic 5.8% |
| Immigrants | Bahamas | 0.1 /100 | #258 | Tragic 5.8% |
| Sub-Saharan Africans | 0.1 /100 | #259 | Tragic 5.8% |
| Immigrants | Uzbekistan | 0.1 /100 | #260 | Tragic 5.8% |
| Immigrants | Guatemala | 0.1 /100 | #261 | Tragic 5.8% |
| Sierra Leoneans | 0.1 /100 | #262 | Tragic 5.8% |
| Salvadorans | 0.1 /100 | #263 | Tragic 5.8% |
| Immigrants | Liberia | 0.1 /100 | #264 | Tragic 5.8% |
| Nigerians | 0.1 /100 | #265 | Tragic 5.8% |
| Mexican American Indians | 0.1 /100 | #266 | Tragic 5.8% |
| Immigrants | Nigeria | 0.1 /100 | #267 | Tragic 5.8% |
| Immigrants | Sierra Leone | 0.1 /100 | #268 | Tragic 5.8% |
| Immigrants | El Salvador | 0.1 /100 | #269 | Tragic 5.8% |
| Blackfeet | 0.1 /100 | #270 | Tragic 5.8% |