Slovene vs Puerto Rican Master's Degree
COMPARE
Slovene
Puerto Rican
Master's Degree
Master's Degree Comparison
Slovenes
Puerto Ricans
15.5%
MASTER'S DEGREE
78.0/ 100
METRIC RATING
150th/ 347
METRIC RANK
11.2%
MASTER'S DEGREE
0.0/ 100
METRIC RATING
308th/ 347
METRIC RANK
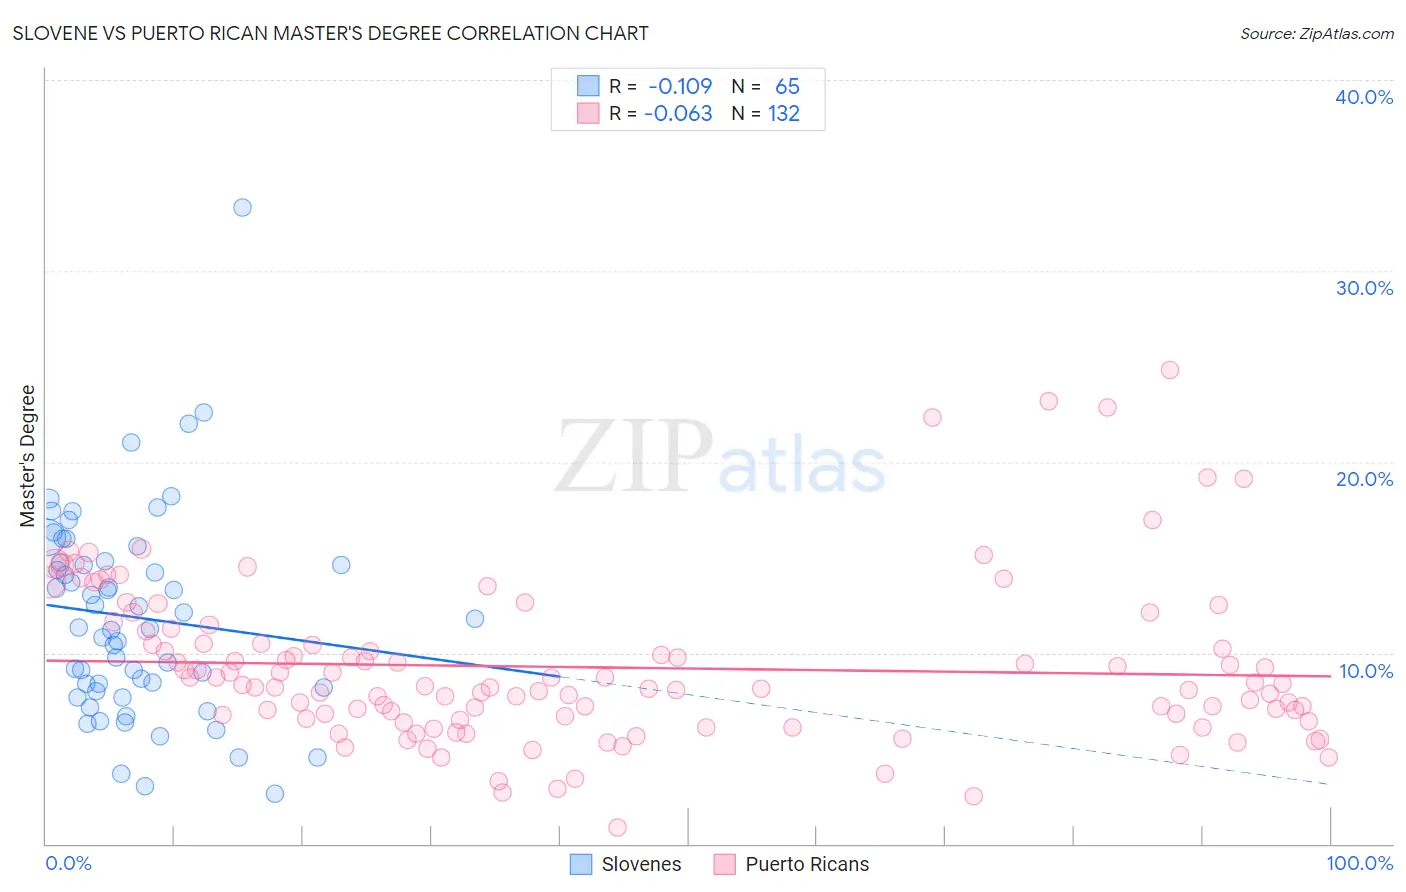
Slovene vs Puerto Rican Master's Degree Correlation Chart
The statistical analysis conducted on geographies consisting of 261,310,088 people shows a poor negative correlation between the proportion of Slovenes and percentage of population with at least master's degree education in the United States with a correlation coefficient (R) of -0.109 and weighted average of 15.5%. Similarly, the statistical analysis conducted on geographies consisting of 527,764,929 people shows a slight negative correlation between the proportion of Puerto Ricans and percentage of population with at least master's degree education in the United States with a correlation coefficient (R) of -0.063 and weighted average of 11.2%, a difference of 39.0%.
Master's Degree Correlation Summary
| Measurement | Slovene | Puerto Rican |
| Minimum | 2.6% | 0.86% |
| Maximum | 33.3% | 24.8% |
| Range | 30.7% | 23.9% |
| Mean | 11.9% | 9.2% |
| Median | 11.3% | 8.2% |
| Interquartile 25% (IQ1) | 8.1% | 6.6% |
| Interquartile 75% (IQ3) | 14.8% | 10.8% |
| Interquartile Range (IQR) | 6.7% | 4.2% |
| Standard Deviation (Sample) | 5.4% | 4.2% |
| Standard Deviation (Population) | 5.3% | 4.2% |
Similar Demographics by Master's Degree
Demographics Similar to Slovenes by Master's Degree
In terms of master's degree, the demographic groups most similar to Slovenes are Ghanaian (15.5%, a difference of 0.030%), Immigrants from Senegal (15.5%, a difference of 0.040%), Iraqi (15.5%, a difference of 0.12%), Slavic (15.5%, a difference of 0.17%), and Icelander (15.5%, a difference of 0.20%).
| Demographics | Rating | Rank | Master's Degree |
| Immigrants | Venezuela | 83.6 /100 | #143 | Excellent 15.7% |
| Canadians | 83.3 /100 | #144 | Excellent 15.7% |
| South Americans | 81.3 /100 | #145 | Excellent 15.6% |
| Immigrants | Afghanistan | 79.4 /100 | #146 | Good 15.6% |
| Hungarians | 79.1 /100 | #147 | Good 15.6% |
| Immigrants | Senegal | 78.2 /100 | #148 | Good 15.5% |
| Ghanaians | 78.2 /100 | #149 | Good 15.5% |
| Slovenes | 78.0 /100 | #150 | Good 15.5% |
| Iraqis | 77.3 /100 | #151 | Good 15.5% |
| Slavs | 77.0 /100 | #152 | Good 15.5% |
| Icelanders | 76.8 /100 | #153 | Good 15.5% |
| Immigrants | South America | 76.3 /100 | #154 | Good 15.5% |
| Immigrants | Bangladesh | 76.1 /100 | #155 | Good 15.5% |
| Bermudans | 73.9 /100 | #156 | Good 15.4% |
| Immigrants | Cameroon | 71.7 /100 | #157 | Good 15.4% |
Demographics Similar to Puerto Ricans by Master's Degree
In terms of master's degree, the demographic groups most similar to Puerto Ricans are Puget Sound Salish (11.1%, a difference of 0.29%), Cheyenne (11.2%, a difference of 0.55%), Shoshone (11.1%, a difference of 0.65%), Mexican American Indian (11.2%, a difference of 0.70%), and Immigrants from Latin America (11.3%, a difference of 0.89%).
| Demographics | Rating | Rank | Master's Degree |
| Tsimshian | 0.1 /100 | #301 | Tragic 11.4% |
| Cherokee | 0.1 /100 | #302 | Tragic 11.4% |
| Immigrants | Laos | 0.1 /100 | #303 | Tragic 11.4% |
| Immigrants | Cabo Verde | 0.1 /100 | #304 | Tragic 11.3% |
| Immigrants | Latin America | 0.0 /100 | #305 | Tragic 11.3% |
| Mexican American Indians | 0.0 /100 | #306 | Tragic 11.2% |
| Cheyenne | 0.0 /100 | #307 | Tragic 11.2% |
| Puerto Ricans | 0.0 /100 | #308 | Tragic 11.2% |
| Puget Sound Salish | 0.0 /100 | #309 | Tragic 11.1% |
| Shoshone | 0.0 /100 | #310 | Tragic 11.1% |
| Seminole | 0.0 /100 | #311 | Tragic 11.0% |
| Choctaw | 0.0 /100 | #312 | Tragic 11.0% |
| Yaqui | 0.0 /100 | #313 | Tragic 11.0% |
| Cajuns | 0.0 /100 | #314 | Tragic 11.0% |
| Apache | 0.0 /100 | #315 | Tragic 11.0% |