Slovene vs Bahamian Unemployment
COMPARE
Slovene
Bahamian
Unemployment
Unemployment Comparison
Slovenes
Bahamians
4.7%
UNEMPLOYMENT
99.9/ 100
METRIC RATING
17th/ 347
METRIC RANK
5.9%
UNEMPLOYMENT
0.0/ 100
METRIC RATING
274th/ 347
METRIC RANK
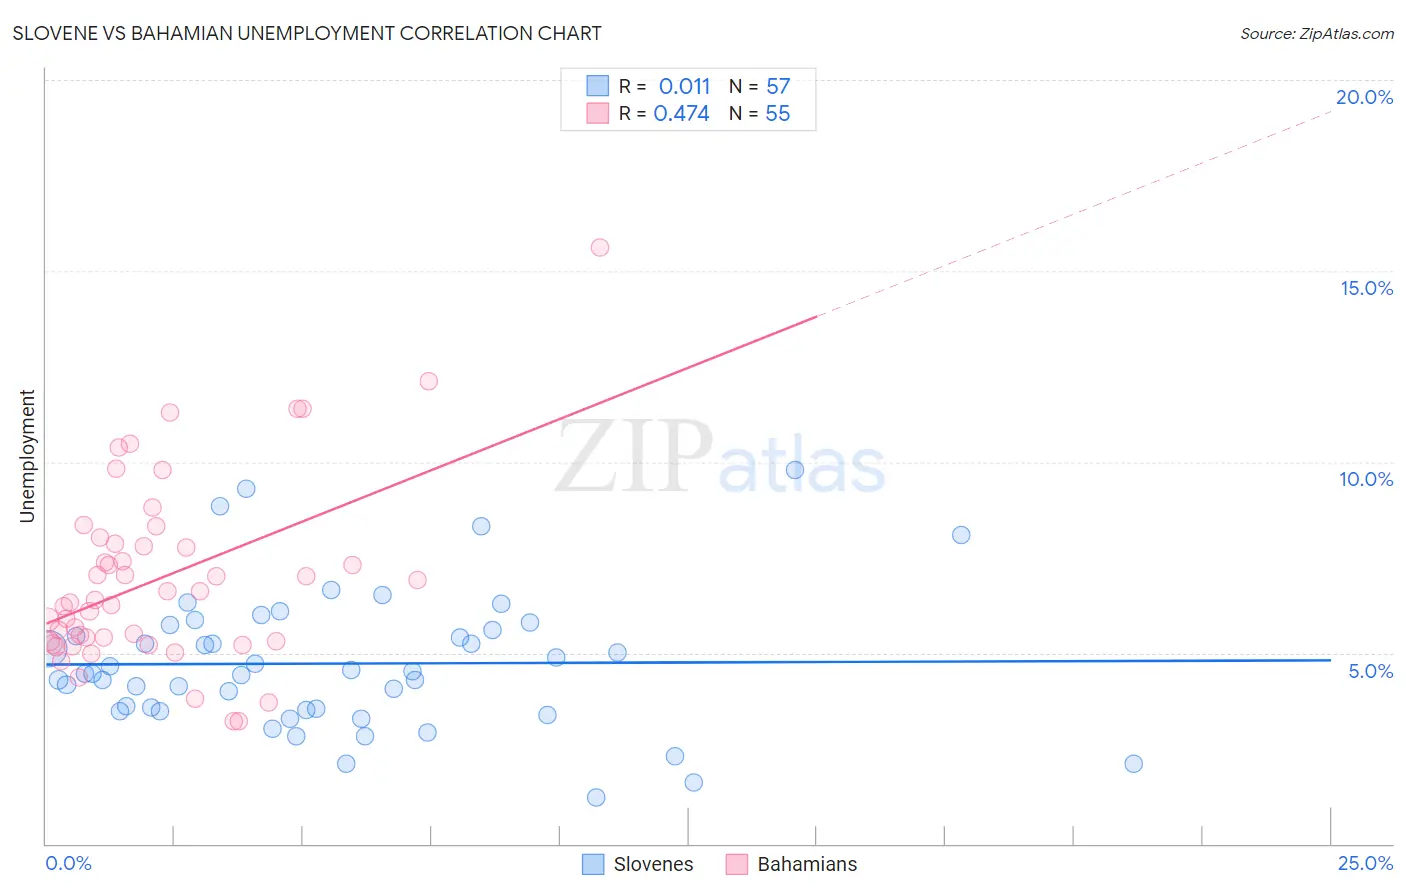
Slovene vs Bahamian Unemployment Correlation Chart
The statistical analysis conducted on geographies consisting of 261,132,264 people shows no correlation between the proportion of Slovenes and unemployment in the United States with a correlation coefficient (R) of 0.011 and weighted average of 4.7%. Similarly, the statistical analysis conducted on geographies consisting of 112,657,665 people shows a moderate positive correlation between the proportion of Bahamians and unemployment in the United States with a correlation coefficient (R) of 0.474 and weighted average of 5.9%, a difference of 27.3%.
Unemployment Correlation Summary
| Measurement | Slovene | Bahamian |
| Minimum | 1.2% | 3.2% |
| Maximum | 9.8% | 15.6% |
| Range | 8.6% | 12.4% |
| Mean | 4.7% | 7.0% |
| Median | 4.5% | 6.4% |
| Interquartile 25% (IQ1) | 3.5% | 5.3% |
| Interquartile 75% (IQ3) | 5.7% | 7.9% |
| Interquartile Range (IQR) | 2.2% | 2.6% |
| Standard Deviation (Sample) | 1.8% | 2.4% |
| Standard Deviation (Population) | 1.8% | 2.4% |
Similar Demographics by Unemployment
Demographics Similar to Slovenes by Unemployment
In terms of unemployment, the demographic groups most similar to Slovenes are Immigrants from Venezuela (4.7%, a difference of 0.020%), Chinese (4.7%, a difference of 0.10%), Scottish (4.7%, a difference of 0.10%), European (4.6%, a difference of 0.24%), and Carpatho Rusyn (4.7%, a difference of 0.69%).
| Demographics | Rating | Rank | Unemployment |
| Dutch | 100.0 /100 | #10 | Exceptional 4.6% |
| English | 100.0 /100 | #11 | Exceptional 4.6% |
| Pennsylvania Germans | 100.0 /100 | #12 | Exceptional 4.6% |
| Belgians | 100.0 /100 | #13 | Exceptional 4.6% |
| Immigrants | Cuba | 100.0 /100 | #14 | Exceptional 4.6% |
| Europeans | 99.9 /100 | #15 | Exceptional 4.6% |
| Chinese | 99.9 /100 | #16 | Exceptional 4.7% |
| Slovenes | 99.9 /100 | #17 | Exceptional 4.7% |
| Immigrants | Venezuela | 99.9 /100 | #18 | Exceptional 4.7% |
| Scottish | 99.9 /100 | #19 | Exceptional 4.7% |
| Carpatho Rusyns | 99.9 /100 | #20 | Exceptional 4.7% |
| Welsh | 99.9 /100 | #21 | Exceptional 4.7% |
| Thais | 99.9 /100 | #22 | Exceptional 4.7% |
| British | 99.9 /100 | #23 | Exceptional 4.7% |
| Venezuelans | 99.9 /100 | #24 | Exceptional 4.7% |
Demographics Similar to Bahamians by Unemployment
In terms of unemployment, the demographic groups most similar to Bahamians are Immigrants from Latin America (5.9%, a difference of 0.21%), Immigrants from Fiji (5.9%, a difference of 0.29%), Hispanic or Latino (5.9%, a difference of 0.46%), Immigrants from Central America (6.0%, a difference of 0.49%), and Armenian (6.0%, a difference of 0.84%).
| Demographics | Rating | Rank | Unemployment |
| Immigrants | Nigeria | 0.1 /100 | #267 | Tragic 5.8% |
| Immigrants | Sierra Leone | 0.1 /100 | #268 | Tragic 5.8% |
| Immigrants | El Salvador | 0.1 /100 | #269 | Tragic 5.8% |
| Blackfeet | 0.1 /100 | #270 | Tragic 5.8% |
| Mexicans | 0.1 /100 | #271 | Tragic 5.9% |
| Hispanics or Latinos | 0.0 /100 | #272 | Tragic 5.9% |
| Immigrants | Fiji | 0.0 /100 | #273 | Tragic 5.9% |
| Bahamians | 0.0 /100 | #274 | Tragic 5.9% |
| Immigrants | Latin America | 0.0 /100 | #275 | Tragic 5.9% |
| Immigrants | Central America | 0.0 /100 | #276 | Tragic 6.0% |
| Armenians | 0.0 /100 | #277 | Tragic 6.0% |
| Ghanaians | 0.0 /100 | #278 | Tragic 6.0% |
| Immigrants | Mexico | 0.0 /100 | #279 | Tragic 6.0% |
| Immigrants | Western Africa | 0.0 /100 | #280 | Tragic 6.0% |
| Africans | 0.0 /100 | #281 | Tragic 6.1% |