Serbian vs Bahamian Unemployment
COMPARE
Serbian
Bahamian
Unemployment
Unemployment Comparison
Serbians
Bahamians
4.9%
UNEMPLOYMENT
98.4/ 100
METRIC RATING
70th/ 347
METRIC RANK
5.9%
UNEMPLOYMENT
0.0/ 100
METRIC RATING
274th/ 347
METRIC RANK
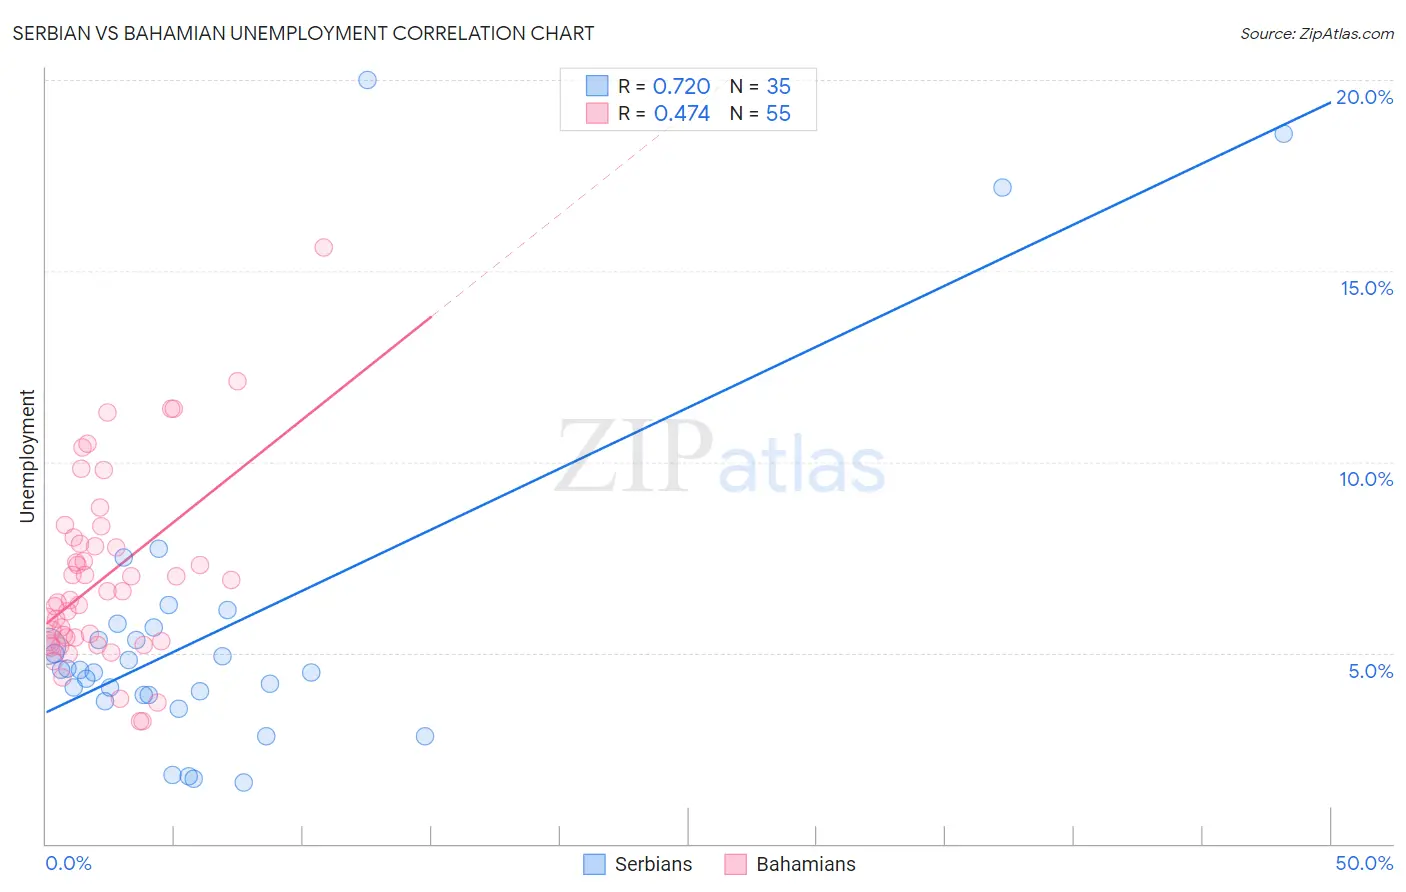
Serbian vs Bahamian Unemployment Correlation Chart
The statistical analysis conducted on geographies consisting of 267,457,297 people shows a strong positive correlation between the proportion of Serbians and unemployment in the United States with a correlation coefficient (R) of 0.720 and weighted average of 4.9%. Similarly, the statistical analysis conducted on geographies consisting of 112,657,665 people shows a moderate positive correlation between the proportion of Bahamians and unemployment in the United States with a correlation coefficient (R) of 0.474 and weighted average of 5.9%, a difference of 20.3%.
Unemployment Correlation Summary
| Measurement | Serbian | Bahamian |
| Minimum | 1.6% | 3.2% |
| Maximum | 20.0% | 15.6% |
| Range | 18.4% | 12.4% |
| Mean | 5.6% | 7.0% |
| Median | 4.6% | 6.4% |
| Interquartile 25% (IQ1) | 3.9% | 5.3% |
| Interquartile 75% (IQ3) | 5.7% | 7.9% |
| Interquartile Range (IQR) | 1.8% | 2.6% |
| Standard Deviation (Sample) | 4.3% | 2.4% |
| Standard Deviation (Population) | 4.2% | 2.4% |
Similar Demographics by Unemployment
Demographics Similar to Serbians by Unemployment
In terms of unemployment, the demographic groups most similar to Serbians are Immigrants from Japan (4.9%, a difference of 0.050%), Burmese (4.9%, a difference of 0.080%), Paraguayan (4.9%, a difference of 0.12%), Immigrants from North America (4.9%, a difference of 0.15%), and Immigrants from Northern Europe (4.9%, a difference of 0.21%).
| Demographics | Rating | Rank | Unemployment |
| Immigrants | Bulgaria | 98.9 /100 | #63 | Exceptional 4.9% |
| Italians | 98.9 /100 | #64 | Exceptional 4.9% |
| Immigrants | Canada | 98.8 /100 | #65 | Exceptional 4.9% |
| Slovaks | 98.7 /100 | #66 | Exceptional 4.9% |
| New Zealanders | 98.6 /100 | #67 | Exceptional 4.9% |
| Slavs | 98.6 /100 | #68 | Exceptional 4.9% |
| Immigrants | North America | 98.5 /100 | #69 | Exceptional 4.9% |
| Serbians | 98.4 /100 | #70 | Exceptional 4.9% |
| Immigrants | Japan | 98.3 /100 | #71 | Exceptional 4.9% |
| Burmese | 98.3 /100 | #72 | Exceptional 4.9% |
| Paraguayans | 98.3 /100 | #73 | Exceptional 4.9% |
| Immigrants | Northern Europe | 98.2 /100 | #74 | Exceptional 4.9% |
| Turks | 98.0 /100 | #75 | Exceptional 4.9% |
| German Russians | 98.0 /100 | #76 | Exceptional 4.9% |
| Cypriots | 97.9 /100 | #77 | Exceptional 4.9% |
Demographics Similar to Bahamians by Unemployment
In terms of unemployment, the demographic groups most similar to Bahamians are Immigrants from Latin America (5.9%, a difference of 0.21%), Immigrants from Fiji (5.9%, a difference of 0.29%), Hispanic or Latino (5.9%, a difference of 0.46%), Immigrants from Central America (6.0%, a difference of 0.49%), and Armenian (6.0%, a difference of 0.84%).
| Demographics | Rating | Rank | Unemployment |
| Immigrants | Nigeria | 0.1 /100 | #267 | Tragic 5.8% |
| Immigrants | Sierra Leone | 0.1 /100 | #268 | Tragic 5.8% |
| Immigrants | El Salvador | 0.1 /100 | #269 | Tragic 5.8% |
| Blackfeet | 0.1 /100 | #270 | Tragic 5.8% |
| Mexicans | 0.1 /100 | #271 | Tragic 5.9% |
| Hispanics or Latinos | 0.0 /100 | #272 | Tragic 5.9% |
| Immigrants | Fiji | 0.0 /100 | #273 | Tragic 5.9% |
| Bahamians | 0.0 /100 | #274 | Tragic 5.9% |
| Immigrants | Latin America | 0.0 /100 | #275 | Tragic 5.9% |
| Immigrants | Central America | 0.0 /100 | #276 | Tragic 6.0% |
| Armenians | 0.0 /100 | #277 | Tragic 6.0% |
| Ghanaians | 0.0 /100 | #278 | Tragic 6.0% |
| Immigrants | Mexico | 0.0 /100 | #279 | Tragic 6.0% |
| Immigrants | Western Africa | 0.0 /100 | #280 | Tragic 6.0% |
| Africans | 0.0 /100 | #281 | Tragic 6.1% |