Basque vs Bahamian Unemployment
COMPARE
Basque
Bahamian
Unemployment
Unemployment Comparison
Basques
Bahamians
5.0%
UNEMPLOYMENT
97.6/ 100
METRIC RATING
81st/ 347
METRIC RANK
5.9%
UNEMPLOYMENT
0.0/ 100
METRIC RATING
274th/ 347
METRIC RANK
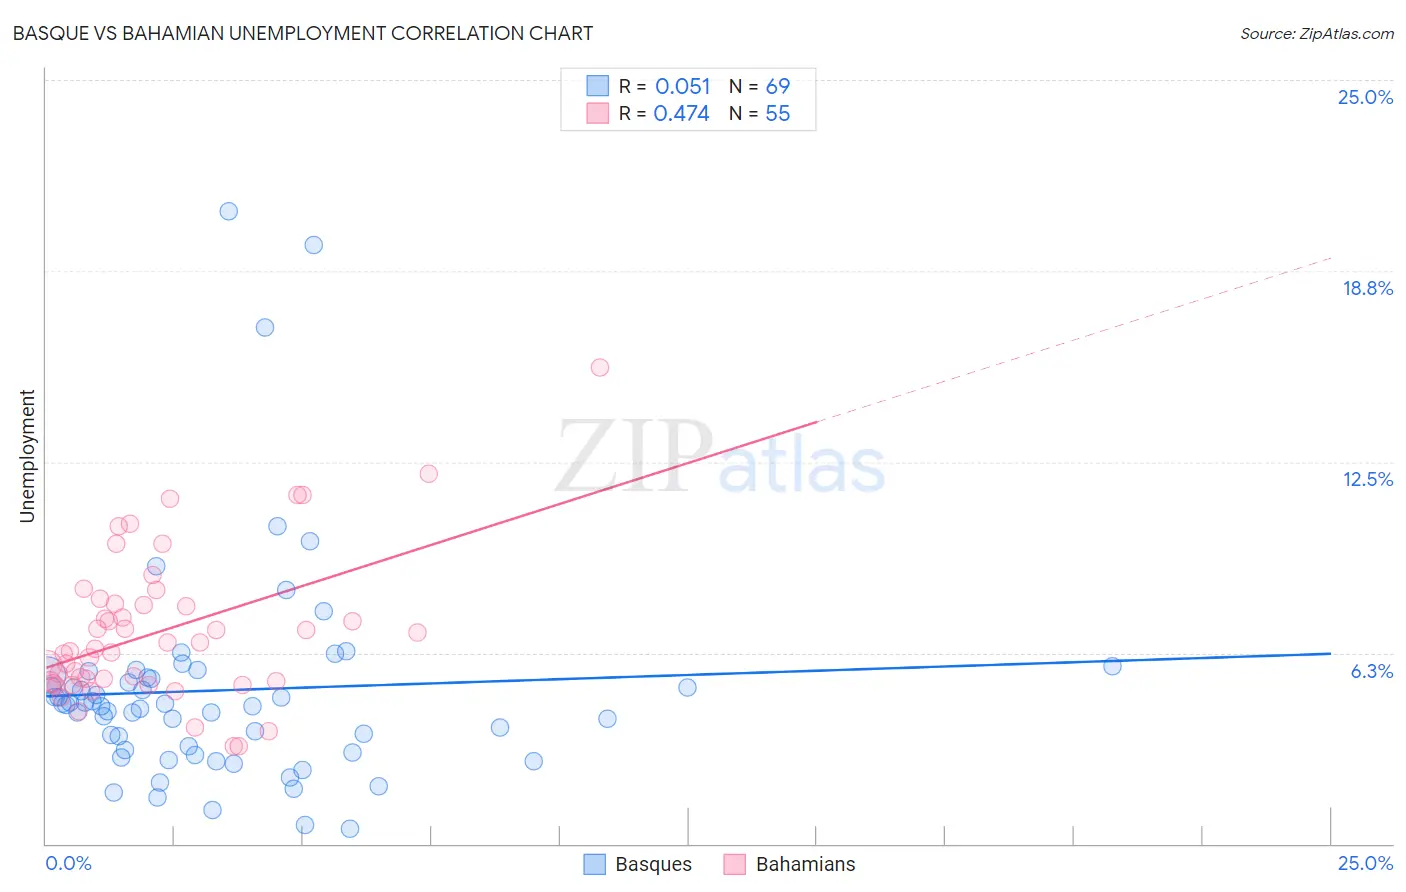
Basque vs Bahamian Unemployment Correlation Chart
The statistical analysis conducted on geographies consisting of 165,724,344 people shows a slight positive correlation between the proportion of Basques and unemployment in the United States with a correlation coefficient (R) of 0.051 and weighted average of 5.0%. Similarly, the statistical analysis conducted on geographies consisting of 112,657,665 people shows a moderate positive correlation between the proportion of Bahamians and unemployment in the United States with a correlation coefficient (R) of 0.474 and weighted average of 5.9%, a difference of 19.5%.
Unemployment Correlation Summary
| Measurement | Basque | Bahamian |
| Minimum | 0.50% | 3.2% |
| Maximum | 20.7% | 15.6% |
| Range | 20.2% | 12.4% |
| Mean | 5.0% | 7.0% |
| Median | 4.5% | 6.4% |
| Interquartile 25% (IQ1) | 3.0% | 5.3% |
| Interquartile 75% (IQ3) | 5.5% | 7.9% |
| Interquartile Range (IQR) | 2.5% | 2.6% |
| Standard Deviation (Sample) | 3.6% | 2.4% |
| Standard Deviation (Population) | 3.6% | 2.4% |
Similar Demographics by Unemployment
Demographics Similar to Basques by Unemployment
In terms of unemployment, the demographic groups most similar to Basques are Immigrants from Sweden (5.0%, a difference of 0.010%), Fijian (5.0%, a difference of 0.010%), Hmong (5.0%, a difference of 0.020%), Canadian (5.0%, a difference of 0.080%), and Russian (5.0%, a difference of 0.10%).
| Demographics | Rating | Rank | Unemployment |
| Immigrants | Northern Europe | 98.2 /100 | #74 | Exceptional 4.9% |
| Turks | 98.0 /100 | #75 | Exceptional 4.9% |
| German Russians | 98.0 /100 | #76 | Exceptional 4.9% |
| Cypriots | 97.9 /100 | #77 | Exceptional 4.9% |
| Okinawans | 97.9 /100 | #78 | Exceptional 4.9% |
| Canadians | 97.7 /100 | #79 | Exceptional 5.0% |
| Immigrants | Sweden | 97.6 /100 | #80 | Exceptional 5.0% |
| Basques | 97.6 /100 | #81 | Exceptional 5.0% |
| Fijians | 97.6 /100 | #82 | Exceptional 5.0% |
| Hmong | 97.6 /100 | #83 | Exceptional 5.0% |
| Russians | 97.4 /100 | #84 | Exceptional 5.0% |
| Immigrants | Australia | 97.0 /100 | #85 | Exceptional 5.0% |
| Hungarians | 96.9 /100 | #86 | Exceptional 5.0% |
| Immigrants | Moldova | 96.6 /100 | #87 | Exceptional 5.0% |
| Immigrants | Korea | 96.6 /100 | #88 | Exceptional 5.0% |
Demographics Similar to Bahamians by Unemployment
In terms of unemployment, the demographic groups most similar to Bahamians are Immigrants from Latin America (5.9%, a difference of 0.21%), Immigrants from Fiji (5.9%, a difference of 0.29%), Hispanic or Latino (5.9%, a difference of 0.46%), Immigrants from Central America (6.0%, a difference of 0.49%), and Armenian (6.0%, a difference of 0.84%).
| Demographics | Rating | Rank | Unemployment |
| Immigrants | Nigeria | 0.1 /100 | #267 | Tragic 5.8% |
| Immigrants | Sierra Leone | 0.1 /100 | #268 | Tragic 5.8% |
| Immigrants | El Salvador | 0.1 /100 | #269 | Tragic 5.8% |
| Blackfeet | 0.1 /100 | #270 | Tragic 5.8% |
| Mexicans | 0.1 /100 | #271 | Tragic 5.9% |
| Hispanics or Latinos | 0.0 /100 | #272 | Tragic 5.9% |
| Immigrants | Fiji | 0.0 /100 | #273 | Tragic 5.9% |
| Bahamians | 0.0 /100 | #274 | Tragic 5.9% |
| Immigrants | Latin America | 0.0 /100 | #275 | Tragic 5.9% |
| Immigrants | Central America | 0.0 /100 | #276 | Tragic 6.0% |
| Armenians | 0.0 /100 | #277 | Tragic 6.0% |
| Ghanaians | 0.0 /100 | #278 | Tragic 6.0% |
| Immigrants | Mexico | 0.0 /100 | #279 | Tragic 6.0% |
| Immigrants | Western Africa | 0.0 /100 | #280 | Tragic 6.0% |
| Africans | 0.0 /100 | #281 | Tragic 6.1% |