Immigrants from Ireland vs Bahamian Unemployment
COMPARE
Immigrants from Ireland
Bahamian
Unemployment
Unemployment Comparison
Immigrants from Ireland
Bahamians
5.1%
UNEMPLOYMENT
92.1/ 100
METRIC RATING
114th/ 347
METRIC RANK
5.9%
UNEMPLOYMENT
0.0/ 100
METRIC RATING
274th/ 347
METRIC RANK
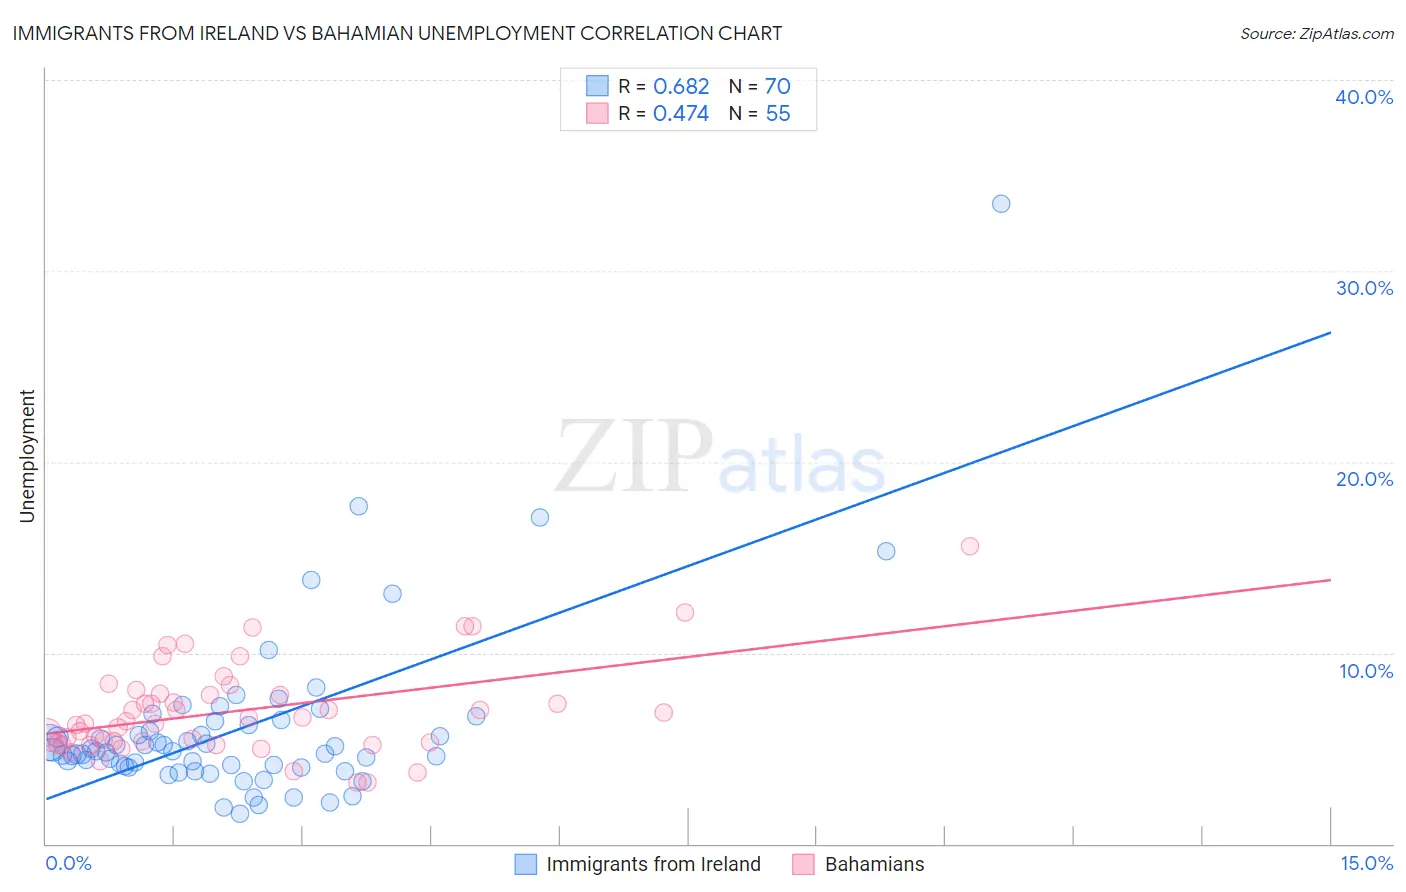
Immigrants from Ireland vs Bahamian Unemployment Correlation Chart
The statistical analysis conducted on geographies consisting of 240,659,680 people shows a significant positive correlation between the proportion of Immigrants from Ireland and unemployment in the United States with a correlation coefficient (R) of 0.682 and weighted average of 5.1%. Similarly, the statistical analysis conducted on geographies consisting of 112,657,665 people shows a moderate positive correlation between the proportion of Bahamians and unemployment in the United States with a correlation coefficient (R) of 0.474 and weighted average of 5.9%, a difference of 17.1%.
Unemployment Correlation Summary
| Measurement | Immigrants from Ireland | Bahamian |
| Minimum | 1.6% | 3.2% |
| Maximum | 33.5% | 15.6% |
| Range | 31.9% | 12.4% |
| Mean | 6.0% | 7.0% |
| Median | 4.9% | 6.4% |
| Interquartile 25% (IQ1) | 4.1% | 5.3% |
| Interquartile 75% (IQ3) | 6.2% | 7.9% |
| Interquartile Range (IQR) | 2.1% | 2.6% |
| Standard Deviation (Sample) | 4.6% | 2.4% |
| Standard Deviation (Population) | 4.6% | 2.4% |
Similar Demographics by Unemployment
Demographics Similar to Immigrants from Ireland by Unemployment
In terms of unemployment, the demographic groups most similar to Immigrants from Ireland are Argentinean (5.1%, a difference of 0.060%), South African (5.1%, a difference of 0.10%), Immigrants from Western Europe (5.1%, a difference of 0.21%), Immigrants from Sri Lanka (5.1%, a difference of 0.22%), and Immigrants from Malaysia (5.1%, a difference of 0.24%).
| Demographics | Rating | Rank | Unemployment |
| Immigrants | Turkey | 93.7 /100 | #107 | Exceptional 5.0% |
| Immigrants | Kuwait | 93.7 /100 | #108 | Exceptional 5.0% |
| Immigrants | Eritrea | 93.3 /100 | #109 | Exceptional 5.0% |
| Immigrants | Lithuania | 93.2 /100 | #110 | Exceptional 5.0% |
| Chileans | 93.2 /100 | #111 | Exceptional 5.0% |
| South Africans | 92.6 /100 | #112 | Exceptional 5.1% |
| Argentineans | 92.4 /100 | #113 | Exceptional 5.1% |
| Immigrants | Ireland | 92.1 /100 | #114 | Exceptional 5.1% |
| Immigrants | Western Europe | 91.1 /100 | #115 | Exceptional 5.1% |
| Immigrants | Sri Lanka | 91.1 /100 | #116 | Exceptional 5.1% |
| Immigrants | Malaysia | 91.0 /100 | #117 | Exceptional 5.1% |
| Immigrants | Germany | 90.8 /100 | #118 | Exceptional 5.1% |
| Immigrants | France | 89.7 /100 | #119 | Excellent 5.1% |
| Macedonians | 89.7 /100 | #120 | Excellent 5.1% |
| Lebanese | 89.2 /100 | #121 | Excellent 5.1% |
Demographics Similar to Bahamians by Unemployment
In terms of unemployment, the demographic groups most similar to Bahamians are Immigrants from Latin America (5.9%, a difference of 0.21%), Immigrants from Fiji (5.9%, a difference of 0.29%), Hispanic or Latino (5.9%, a difference of 0.46%), Immigrants from Central America (6.0%, a difference of 0.49%), and Armenian (6.0%, a difference of 0.84%).
| Demographics | Rating | Rank | Unemployment |
| Immigrants | Nigeria | 0.1 /100 | #267 | Tragic 5.8% |
| Immigrants | Sierra Leone | 0.1 /100 | #268 | Tragic 5.8% |
| Immigrants | El Salvador | 0.1 /100 | #269 | Tragic 5.8% |
| Blackfeet | 0.1 /100 | #270 | Tragic 5.8% |
| Mexicans | 0.1 /100 | #271 | Tragic 5.9% |
| Hispanics or Latinos | 0.0 /100 | #272 | Tragic 5.9% |
| Immigrants | Fiji | 0.0 /100 | #273 | Tragic 5.9% |
| Bahamians | 0.0 /100 | #274 | Tragic 5.9% |
| Immigrants | Latin America | 0.0 /100 | #275 | Tragic 5.9% |
| Immigrants | Central America | 0.0 /100 | #276 | Tragic 6.0% |
| Armenians | 0.0 /100 | #277 | Tragic 6.0% |
| Ghanaians | 0.0 /100 | #278 | Tragic 6.0% |
| Immigrants | Mexico | 0.0 /100 | #279 | Tragic 6.0% |
| Immigrants | Western Africa | 0.0 /100 | #280 | Tragic 6.0% |
| Africans | 0.0 /100 | #281 | Tragic 6.1% |