Sioux vs Peruvian Unemployment Among Ages 60 to 64 years
COMPARE
Sioux
Peruvian
Unemployment Among Ages 60 to 64 years
Unemployment Among Ages 60 to 64 years Comparison
Sioux
Peruvians
5.1%
UNEMPLOYMENT AMONG AGES 60 TO 64 YEARS
0.3/ 100
METRIC RATING
264th/ 347
METRIC RANK
5.0%
UNEMPLOYMENT AMONG AGES 60 TO 64 YEARS
1.6/ 100
METRIC RATING
244th/ 347
METRIC RANK
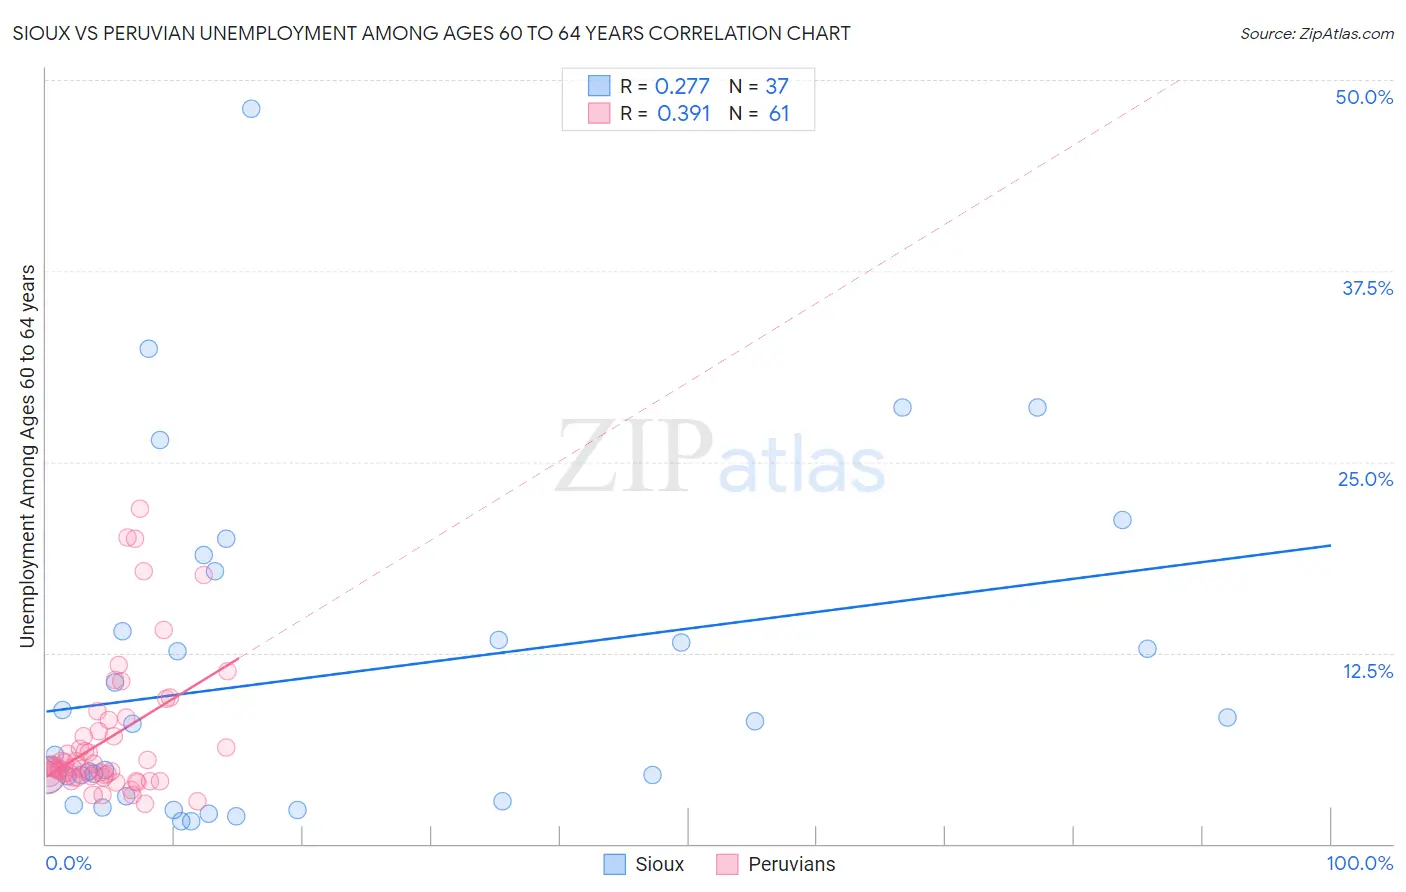
Sioux vs Peruvian Unemployment Among Ages 60 to 64 years Correlation Chart
The statistical analysis conducted on geographies consisting of 214,355,270 people shows a weak positive correlation between the proportion of Sioux and unemployment rate among population between the ages 60 and 64 in the United States with a correlation coefficient (R) of 0.277 and weighted average of 5.1%. Similarly, the statistical analysis conducted on geographies consisting of 335,688,076 people shows a mild positive correlation between the proportion of Peruvians and unemployment rate among population between the ages 60 and 64 in the United States with a correlation coefficient (R) of 0.391 and weighted average of 5.0%, a difference of 1.4%.
Unemployment Among Ages 60 to 64 years Correlation Summary
| Measurement | Sioux | Peruvian |
| Minimum | 1.5% | 2.6% |
| Maximum | 48.1% | 21.9% |
| Range | 46.6% | 19.3% |
| Mean | 11.1% | 6.9% |
| Median | 7.8% | 5.0% |
| Interquartile 25% (IQ1) | 3.0% | 4.4% |
| Interquartile 75% (IQ3) | 15.9% | 7.8% |
| Interquartile Range (IQR) | 12.9% | 3.4% |
| Standard Deviation (Sample) | 10.7% | 4.5% |
| Standard Deviation (Population) | 10.6% | 4.4% |
Demographics Similar to Sioux and Peruvians by Unemployment Among Ages 60 to 64 years
In terms of unemployment among ages 60 to 64 years, the demographic groups most similar to Sioux are Immigrants (5.1%, a difference of 0.080%), Immigrants from Uzbekistan (5.1%, a difference of 0.10%), Immigrants from Ghana (5.1%, a difference of 0.12%), Immigrants from Honduras (5.1%, a difference of 0.22%), and Honduran (5.1%, a difference of 0.35%). Similarly, the demographic groups most similar to Peruvians are Comanche (5.0%, a difference of 0.17%), Immigrants from South America (5.0%, a difference of 0.30%), Immigrants from North Macedonia (5.0%, a difference of 0.30%), Immigrants from Fiji (5.1%, a difference of 0.35%), and South American (5.1%, a difference of 0.38%).
| Demographics | Rating | Rank | Unemployment Among Ages 60 to 64 years |
| Peruvians | 1.6 /100 | #244 | Tragic 5.0% |
| Comanche | 1.3 /100 | #245 | Tragic 5.0% |
| Immigrants | South America | 1.1 /100 | #246 | Tragic 5.0% |
| Immigrants | North Macedonia | 1.1 /100 | #247 | Tragic 5.0% |
| Immigrants | Fiji | 1.1 /100 | #248 | Tragic 5.1% |
| South Americans | 1.0 /100 | #249 | Tragic 5.1% |
| Immigrants | Cambodia | 0.9 /100 | #250 | Tragic 5.1% |
| Immigrants | Uruguay | 0.9 /100 | #251 | Tragic 5.1% |
| Immigrants | Switzerland | 0.9 /100 | #252 | Tragic 5.1% |
| Immigrants | China | 0.9 /100 | #253 | Tragic 5.1% |
| Costa Ricans | 0.8 /100 | #254 | Tragic 5.1% |
| Estonians | 0.8 /100 | #255 | Tragic 5.1% |
| Immigrants | Peru | 0.7 /100 | #256 | Tragic 5.1% |
| Japanese | 0.6 /100 | #257 | Tragic 5.1% |
| Celtics | 0.5 /100 | #258 | Tragic 5.1% |
| Hondurans | 0.5 /100 | #259 | Tragic 5.1% |
| Immigrants | Honduras | 0.4 /100 | #260 | Tragic 5.1% |
| Immigrants | Ghana | 0.4 /100 | #261 | Tragic 5.1% |
| Immigrants | Uzbekistan | 0.4 /100 | #262 | Tragic 5.1% |
| Immigrants | Immigrants | 0.4 /100 | #263 | Tragic 5.1% |
| Sioux | 0.3 /100 | #264 | Tragic 5.1% |