Sioux vs Mexican American Indian Unemployment Among Ages 60 to 64 years
COMPARE
Sioux
Mexican American Indian
Unemployment Among Ages 60 to 64 years
Unemployment Among Ages 60 to 64 years Comparison
Sioux
Mexican American Indians
5.1%
UNEMPLOYMENT AMONG AGES 60 TO 64 YEARS
0.3/ 100
METRIC RATING
264th/ 347
METRIC RANK
5.3%
UNEMPLOYMENT AMONG AGES 60 TO 64 YEARS
0.0/ 100
METRIC RATING
286th/ 347
METRIC RANK
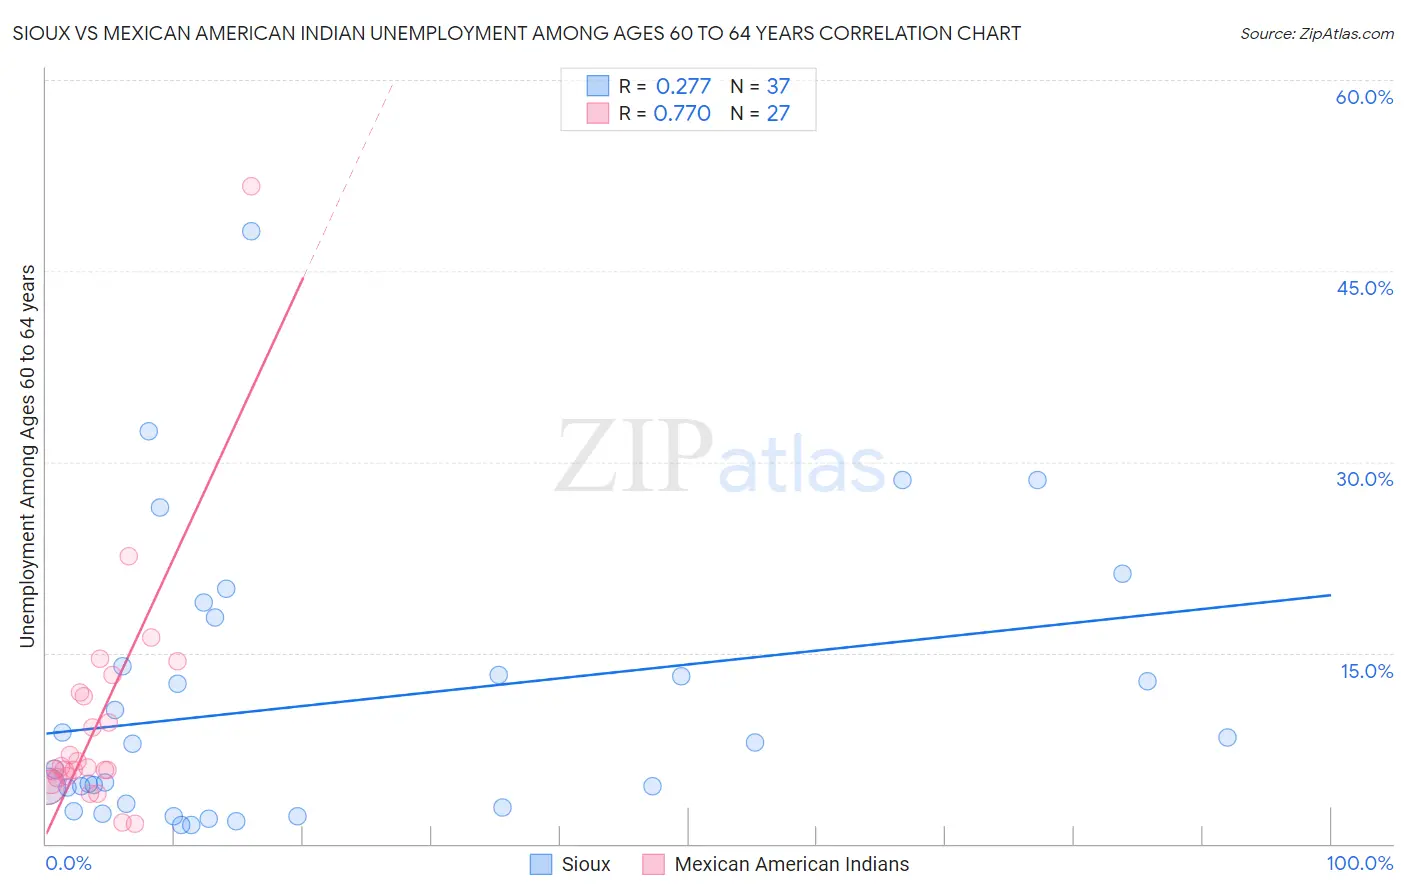
Sioux vs Mexican American Indian Unemployment Among Ages 60 to 64 years Correlation Chart
The statistical analysis conducted on geographies consisting of 214,355,270 people shows a weak positive correlation between the proportion of Sioux and unemployment rate among population between the ages 60 and 64 in the United States with a correlation coefficient (R) of 0.277 and weighted average of 5.1%. Similarly, the statistical analysis conducted on geographies consisting of 293,329,819 people shows a strong positive correlation between the proportion of Mexican American Indians and unemployment rate among population between the ages 60 and 64 in the United States with a correlation coefficient (R) of 0.770 and weighted average of 5.3%, a difference of 3.5%.
Unemployment Among Ages 60 to 64 years Correlation Summary
| Measurement | Sioux | Mexican American Indian |
| Minimum | 1.5% | 1.6% |
| Maximum | 48.1% | 51.7% |
| Range | 46.6% | 50.1% |
| Mean | 11.1% | 9.6% |
| Median | 7.8% | 6.0% |
| Interquartile 25% (IQ1) | 3.0% | 5.2% |
| Interquartile 75% (IQ3) | 15.9% | 11.9% |
| Interquartile Range (IQR) | 12.9% | 6.7% |
| Standard Deviation (Sample) | 10.7% | 9.7% |
| Standard Deviation (Population) | 10.6% | 9.5% |
Similar Demographics by Unemployment Among Ages 60 to 64 years
Demographics Similar to Sioux by Unemployment Among Ages 60 to 64 years
In terms of unemployment among ages 60 to 64 years, the demographic groups most similar to Sioux are Immigrants (5.1%, a difference of 0.080%), Immigrants from Uzbekistan (5.1%, a difference of 0.10%), Immigrants from Ghana (5.1%, a difference of 0.12%), Immigrants from Honduras (5.1%, a difference of 0.22%), and Immigrants from Argentina (5.1%, a difference of 0.34%).
| Demographics | Rating | Rank | Unemployment Among Ages 60 to 64 years |
| Japanese | 0.6 /100 | #257 | Tragic 5.1% |
| Celtics | 0.5 /100 | #258 | Tragic 5.1% |
| Hondurans | 0.5 /100 | #259 | Tragic 5.1% |
| Immigrants | Honduras | 0.4 /100 | #260 | Tragic 5.1% |
| Immigrants | Ghana | 0.4 /100 | #261 | Tragic 5.1% |
| Immigrants | Uzbekistan | 0.4 /100 | #262 | Tragic 5.1% |
| Immigrants | Immigrants | 0.4 /100 | #263 | Tragic 5.1% |
| Sioux | 0.3 /100 | #264 | Tragic 5.1% |
| Immigrants | Argentina | 0.2 /100 | #265 | Tragic 5.1% |
| Immigrants | Australia | 0.2 /100 | #266 | Tragic 5.1% |
| Immigrants | Bahamas | 0.2 /100 | #267 | Tragic 5.1% |
| Central American Indians | 0.2 /100 | #268 | Tragic 5.1% |
| Immigrants | Costa Rica | 0.2 /100 | #269 | Tragic 5.1% |
| Immigrants | Iran | 0.1 /100 | #270 | Tragic 5.1% |
| Israelis | 0.1 /100 | #271 | Tragic 5.2% |
Demographics Similar to Mexican American Indians by Unemployment Among Ages 60 to 64 years
In terms of unemployment among ages 60 to 64 years, the demographic groups most similar to Mexican American Indians are Salvadoran (5.3%, a difference of 0.040%), West Indian (5.3%, a difference of 0.11%), Trinidadian and Tobagonian (5.3%, a difference of 0.22%), Taiwanese (5.3%, a difference of 0.24%), and Spanish American (5.3%, a difference of 0.25%).
| Demographics | Rating | Rank | Unemployment Among Ages 60 to 64 years |
| Nepalese | 0.0 /100 | #279 | Tragic 5.2% |
| French American Indians | 0.0 /100 | #280 | Tragic 5.2% |
| Immigrants | Haiti | 0.0 /100 | #281 | Tragic 5.2% |
| Mexicans | 0.0 /100 | #282 | Tragic 5.2% |
| Immigrants | Guatemala | 0.0 /100 | #283 | Tragic 5.3% |
| Taiwanese | 0.0 /100 | #284 | Tragic 5.3% |
| West Indians | 0.0 /100 | #285 | Tragic 5.3% |
| Mexican American Indians | 0.0 /100 | #286 | Tragic 5.3% |
| Salvadorans | 0.0 /100 | #287 | Tragic 5.3% |
| Trinidadians and Tobagonians | 0.0 /100 | #288 | Tragic 5.3% |
| Spanish Americans | 0.0 /100 | #289 | Tragic 5.3% |
| Immigrants | Trinidad and Tobago | 0.0 /100 | #290 | Tragic 5.3% |
| Hispanics or Latinos | 0.0 /100 | #291 | Tragic 5.3% |
| Immigrants | Latin America | 0.0 /100 | #292 | Tragic 5.3% |
| Immigrants | Israel | 0.0 /100 | #293 | Tragic 5.3% |