Sioux vs Peruvian Child Poverty Among Girls Under 16
COMPARE
Sioux
Peruvian
Child Poverty Among Girls Under 16
Child Poverty Among Girls Under 16 Comparison
Sioux
Peruvians
25.6%
CHILD POVERTY AMONG GIRLS UNDER 16
0.0/ 100
METRIC RATING
336th/ 347
METRIC RANK
15.4%
CHILD POVERTY AMONG GIRLS UNDER 16
91.2/ 100
METRIC RATING
125th/ 347
METRIC RANK
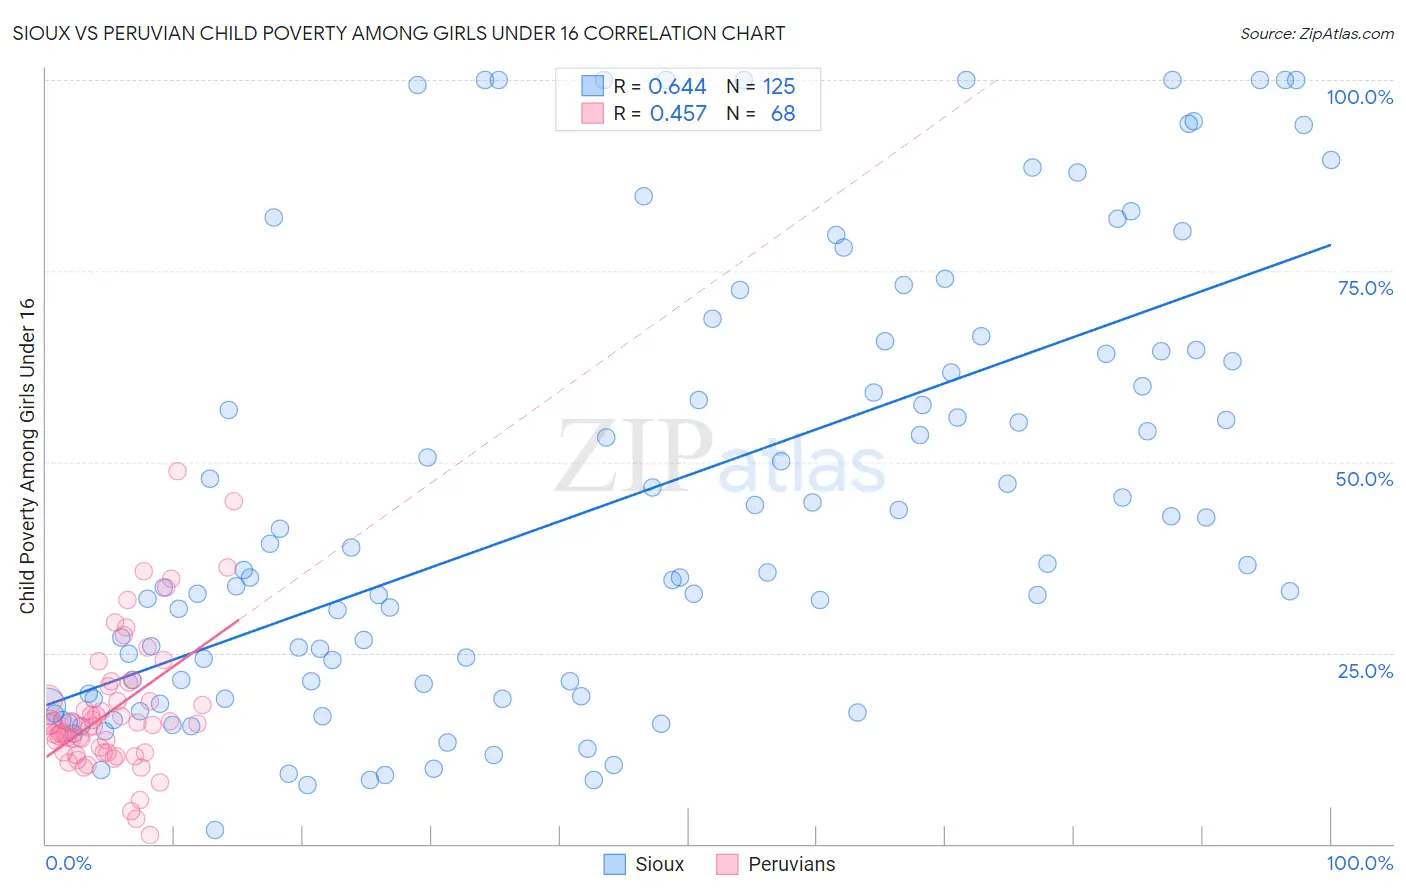
Sioux vs Peruvian Child Poverty Among Girls Under 16 Correlation Chart
The statistical analysis conducted on geographies consisting of 231,838,275 people shows a significant positive correlation between the proportion of Sioux and poverty level among girls under the age of 16 in the United States with a correlation coefficient (R) of 0.644 and weighted average of 25.6%. Similarly, the statistical analysis conducted on geographies consisting of 357,519,236 people shows a moderate positive correlation between the proportion of Peruvians and poverty level among girls under the age of 16 in the United States with a correlation coefficient (R) of 0.457 and weighted average of 15.4%, a difference of 66.4%.
Child Poverty Among Girls Under 16 Correlation Summary
| Measurement | Sioux | Peruvian |
| Minimum | 1.8% | 1.1% |
| Maximum | 100.0% | 48.7% |
| Range | 98.2% | 47.7% |
| Mean | 45.0% | 17.5% |
| Median | 35.9% | 15.6% |
| Interquartile 25% (IQ1) | 19.5% | 12.0% |
| Interquartile 75% (IQ3) | 64.6% | 19.8% |
| Interquartile Range (IQR) | 45.1% | 7.8% |
| Standard Deviation (Sample) | 28.8% | 8.9% |
| Standard Deviation (Population) | 28.7% | 8.8% |
Similar Demographics by Child Poverty Among Girls Under 16
Demographics Similar to Sioux by Child Poverty Among Girls Under 16
In terms of child poverty among girls under 16, the demographic groups most similar to Sioux are Yup'ik (25.8%, a difference of 0.93%), Pueblo (25.2%, a difference of 1.5%), Menominee (25.0%, a difference of 2.2%), Cheyenne (26.3%, a difference of 2.7%), and Crow (26.4%, a difference of 3.1%).
| Demographics | Rating | Rank | Child Poverty Among Girls Under 16 |
| Kiowa | 0.0 /100 | #329 | Tragic 23.7% |
| Immigrants | Dominican Republic | 0.0 /100 | #330 | Tragic 23.8% |
| Apache | 0.0 /100 | #331 | Tragic 23.8% |
| Natives/Alaskans | 0.0 /100 | #332 | Tragic 24.0% |
| Blacks/African Americans | 0.0 /100 | #333 | Tragic 24.7% |
| Menominee | 0.0 /100 | #334 | Tragic 25.0% |
| Pueblo | 0.0 /100 | #335 | Tragic 25.2% |
| Sioux | 0.0 /100 | #336 | Tragic 25.6% |
| Yup'ik | 0.0 /100 | #337 | Tragic 25.8% |
| Cheyenne | 0.0 /100 | #338 | Tragic 26.3% |
| Crow | 0.0 /100 | #339 | Tragic 26.4% |
| Yuman | 0.0 /100 | #340 | Tragic 27.1% |
| Hopi | 0.0 /100 | #341 | Tragic 27.9% |
| Pima | 0.0 /100 | #342 | Tragic 28.2% |
| Immigrants | Yemen | 0.0 /100 | #343 | Tragic 29.5% |
Demographics Similar to Peruvians by Child Poverty Among Girls Under 16
In terms of child poverty among girls under 16, the demographic groups most similar to Peruvians are Scottish (15.4%, a difference of 0.070%), Carpatho Rusyn (15.3%, a difference of 0.11%), Immigrants from Norway (15.4%, a difference of 0.13%), Irish (15.3%, a difference of 0.15%), and Albanian (15.4%, a difference of 0.23%).
| Demographics | Rating | Rank | Child Poverty Among Girls Under 16 |
| Immigrants | Southern Europe | 92.7 /100 | #118 | Exceptional 15.3% |
| Immigrants | Zimbabwe | 92.5 /100 | #119 | Exceptional 15.3% |
| Pakistanis | 92.3 /100 | #120 | Exceptional 15.3% |
| English | 92.2 /100 | #121 | Exceptional 15.3% |
| Portuguese | 91.8 /100 | #122 | Exceptional 15.3% |
| Irish | 91.5 /100 | #123 | Exceptional 15.3% |
| Carpatho Rusyns | 91.4 /100 | #124 | Exceptional 15.3% |
| Peruvians | 91.2 /100 | #125 | Exceptional 15.4% |
| Scottish | 91.0 /100 | #126 | Exceptional 15.4% |
| Immigrants | Norway | 90.8 /100 | #127 | Exceptional 15.4% |
| Albanians | 90.5 /100 | #128 | Exceptional 15.4% |
| Immigrants | South Eastern Asia | 90.5 /100 | #129 | Exceptional 15.4% |
| Puget Sound Salish | 90.1 /100 | #130 | Exceptional 15.4% |
| Immigrants | Western Europe | 90.0 /100 | #131 | Exceptional 15.4% |
| Mongolians | 89.7 /100 | #132 | Excellent 15.4% |