Immigrants from Fiji vs Peruvian Unemployment Among Ages 60 to 64 years
COMPARE
Immigrants from Fiji
Peruvian
Unemployment Among Ages 60 to 64 years
Unemployment Among Ages 60 to 64 years Comparison
Immigrants from Fiji
Peruvians
5.1%
UNEMPLOYMENT AMONG AGES 60 TO 64 YEARS
1.1/ 100
METRIC RATING
248th/ 347
METRIC RANK
5.0%
UNEMPLOYMENT AMONG AGES 60 TO 64 YEARS
1.6/ 100
METRIC RATING
244th/ 347
METRIC RANK
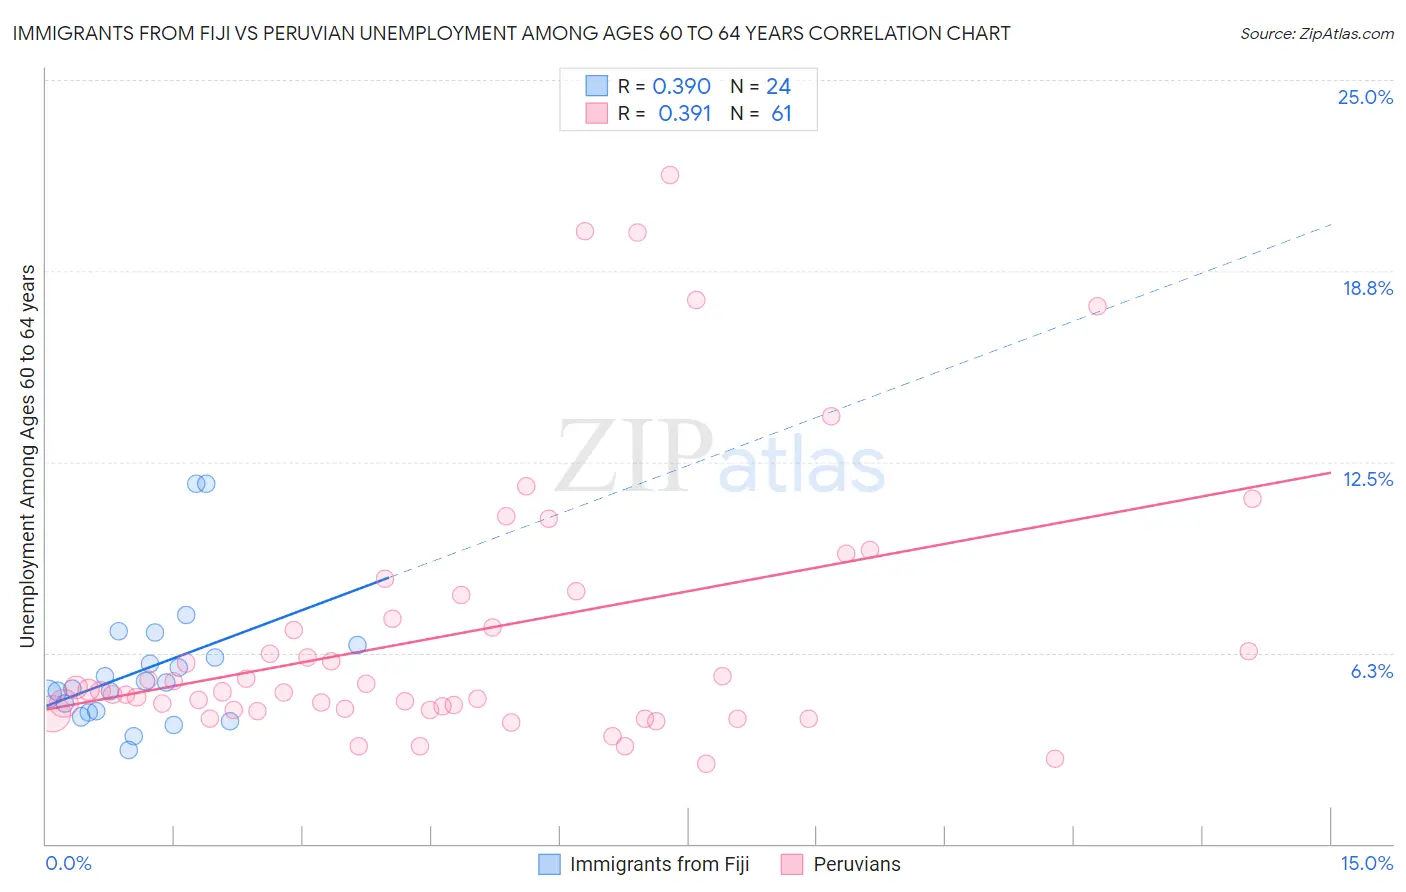
Immigrants from Fiji vs Peruvian Unemployment Among Ages 60 to 64 years Correlation Chart
The statistical analysis conducted on geographies consisting of 91,801,699 people shows a mild positive correlation between the proportion of Immigrants from Fiji and unemployment rate among population between the ages 60 and 64 in the United States with a correlation coefficient (R) of 0.390 and weighted average of 5.1%. Similarly, the statistical analysis conducted on geographies consisting of 335,688,076 people shows a mild positive correlation between the proportion of Peruvians and unemployment rate among population between the ages 60 and 64 in the United States with a correlation coefficient (R) of 0.391 and weighted average of 5.0%, a difference of 0.35%.
Unemployment Among Ages 60 to 64 years Correlation Summary
| Measurement | Immigrants from Fiji | Peruvian |
| Minimum | 3.1% | 2.6% |
| Maximum | 11.8% | 21.9% |
| Range | 8.7% | 19.3% |
| Mean | 5.7% | 6.9% |
| Median | 5.2% | 5.0% |
| Interquartile 25% (IQ1) | 4.3% | 4.4% |
| Interquartile 75% (IQ3) | 6.3% | 7.8% |
| Interquartile Range (IQR) | 2.0% | 3.4% |
| Standard Deviation (Sample) | 2.2% | 4.5% |
| Standard Deviation (Population) | 2.1% | 4.4% |
Demographics Similar to Immigrants from Fiji and Peruvians by Unemployment Among Ages 60 to 64 years
In terms of unemployment among ages 60 to 64 years, the demographic groups most similar to Immigrants from Fiji are South American (5.1%, a difference of 0.030%), Immigrants from South America (5.0%, a difference of 0.050%), Immigrants from North Macedonia (5.0%, a difference of 0.050%), Immigrants from Cambodia (5.1%, a difference of 0.12%), and Immigrants from Uruguay (5.1%, a difference of 0.15%). Similarly, the demographic groups most similar to Peruvians are Immigrants from Philippines (5.0%, a difference of 0.12%), Comanche (5.0%, a difference of 0.17%), Argentinean (5.0%, a difference of 0.22%), Indian (Asian) (5.0%, a difference of 0.27%), and Immigrants from Croatia (5.0%, a difference of 0.28%).
| Demographics | Rating | Rank | Unemployment Among Ages 60 to 64 years |
| Immigrants | Sierra Leone | 3.1 /100 | #236 | Tragic 5.0% |
| Immigrants | Western Asia | 3.0 /100 | #237 | Tragic 5.0% |
| Immigrants | Poland | 3.0 /100 | #238 | Tragic 5.0% |
| Ghanaians | 2.4 /100 | #239 | Tragic 5.0% |
| Immigrants | Croatia | 2.2 /100 | #240 | Tragic 5.0% |
| Indians (Asian) | 2.2 /100 | #241 | Tragic 5.0% |
| Argentineans | 2.1 /100 | #242 | Tragic 5.0% |
| Immigrants | Philippines | 1.9 /100 | #243 | Tragic 5.0% |
| Peruvians | 1.6 /100 | #244 | Tragic 5.0% |
| Comanche | 1.3 /100 | #245 | Tragic 5.0% |
| Immigrants | South America | 1.1 /100 | #246 | Tragic 5.0% |
| Immigrants | North Macedonia | 1.1 /100 | #247 | Tragic 5.0% |
| Immigrants | Fiji | 1.1 /100 | #248 | Tragic 5.1% |
| South Americans | 1.0 /100 | #249 | Tragic 5.1% |
| Immigrants | Cambodia | 0.9 /100 | #250 | Tragic 5.1% |
| Immigrants | Uruguay | 0.9 /100 | #251 | Tragic 5.1% |
| Immigrants | Switzerland | 0.9 /100 | #252 | Tragic 5.1% |
| Immigrants | China | 0.9 /100 | #253 | Tragic 5.1% |
| Costa Ricans | 0.8 /100 | #254 | Tragic 5.1% |
| Estonians | 0.8 /100 | #255 | Tragic 5.1% |
| Immigrants | Peru | 0.7 /100 | #256 | Tragic 5.1% |