Sioux vs Mexican Unemployment Among Ages 60 to 64 years
COMPARE
Sioux
Mexican
Unemployment Among Ages 60 to 64 years
Unemployment Among Ages 60 to 64 years Comparison
Sioux
Mexicans
5.1%
UNEMPLOYMENT AMONG AGES 60 TO 64 YEARS
0.3/ 100
METRIC RATING
264th/ 347
METRIC RANK
5.2%
UNEMPLOYMENT AMONG AGES 60 TO 64 YEARS
0.0/ 100
METRIC RATING
282nd/ 347
METRIC RANK
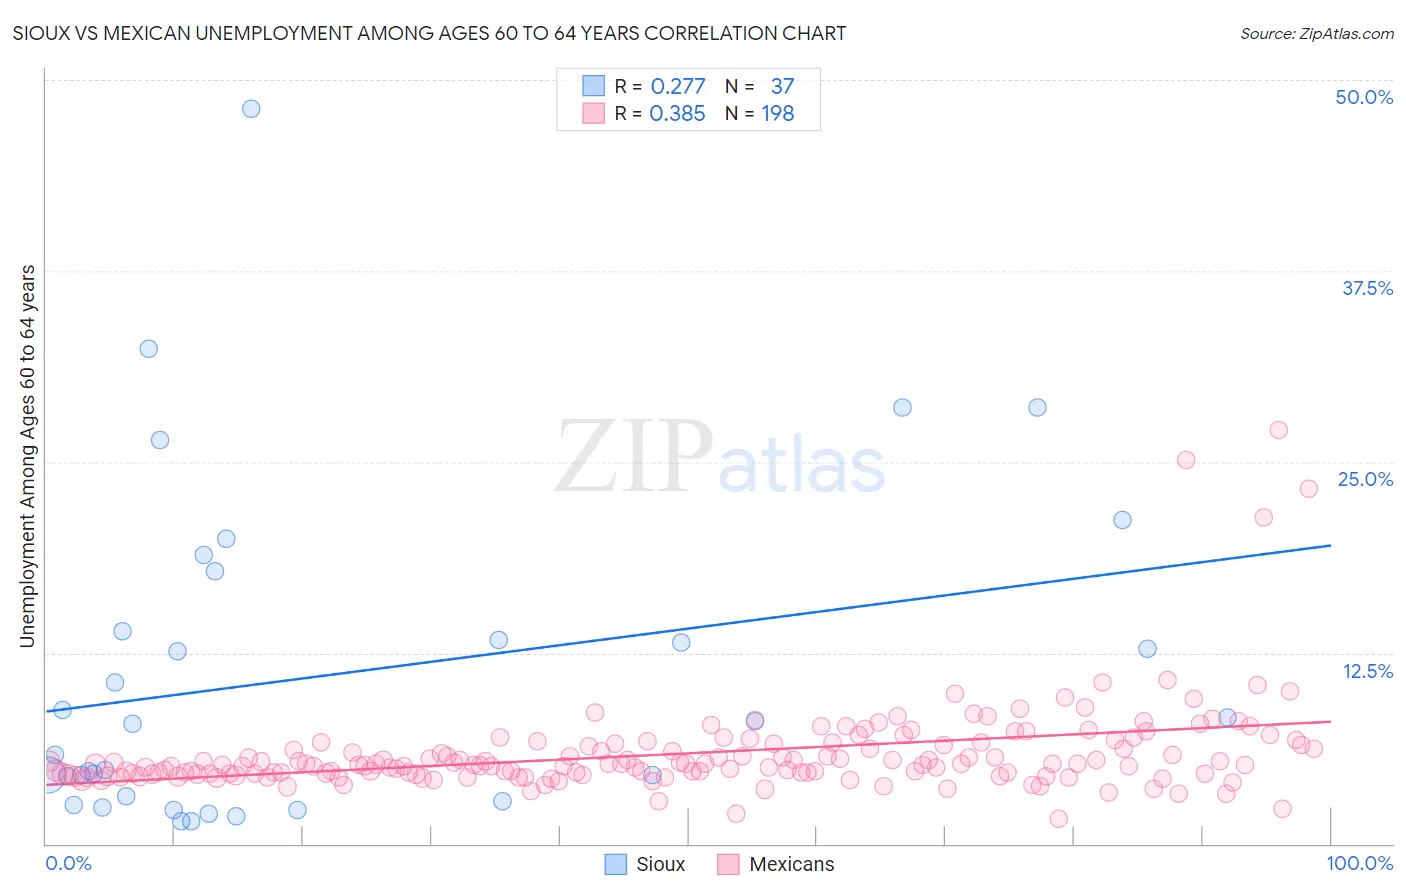
Sioux vs Mexican Unemployment Among Ages 60 to 64 years Correlation Chart
The statistical analysis conducted on geographies consisting of 214,355,270 people shows a weak positive correlation between the proportion of Sioux and unemployment rate among population between the ages 60 and 64 in the United States with a correlation coefficient (R) of 0.277 and weighted average of 5.1%. Similarly, the statistical analysis conducted on geographies consisting of 464,555,548 people shows a mild positive correlation between the proportion of Mexicans and unemployment rate among population between the ages 60 and 64 in the United States with a correlation coefficient (R) of 0.385 and weighted average of 5.2%, a difference of 2.7%.
Unemployment Among Ages 60 to 64 years Correlation Summary
| Measurement | Sioux | Mexican |
| Minimum | 1.5% | 1.6% |
| Maximum | 48.1% | 27.1% |
| Range | 46.6% | 25.5% |
| Mean | 11.1% | 5.9% |
| Median | 7.8% | 5.2% |
| Interquartile 25% (IQ1) | 3.0% | 4.6% |
| Interquartile 75% (IQ3) | 15.9% | 6.5% |
| Interquartile Range (IQR) | 12.9% | 1.9% |
| Standard Deviation (Sample) | 10.7% | 3.1% |
| Standard Deviation (Population) | 10.6% | 3.1% |
Demographics Similar to Sioux and Mexicans by Unemployment Among Ages 60 to 64 years
In terms of unemployment among ages 60 to 64 years, the demographic groups most similar to Sioux are Immigrants (5.1%, a difference of 0.080%), Immigrants from Argentina (5.1%, a difference of 0.34%), Immigrants from Australia (5.1%, a difference of 0.36%), Immigrants from Bahamas (5.1%, a difference of 0.41%), and Central American Indian (5.1%, a difference of 0.58%). Similarly, the demographic groups most similar to Mexicans are Immigrants from Haiti (5.2%, a difference of 0.0%), Nepalese (5.2%, a difference of 0.050%), French American Indian (5.2%, a difference of 0.050%), Guatemalan (5.2%, a difference of 0.25%), and Immigrants from Guatemala (5.3%, a difference of 0.43%).
| Demographics | Rating | Rank | Unemployment Among Ages 60 to 64 years |
| Immigrants | Immigrants | 0.4 /100 | #263 | Tragic 5.1% |
| Sioux | 0.3 /100 | #264 | Tragic 5.1% |
| Immigrants | Argentina | 0.2 /100 | #265 | Tragic 5.1% |
| Immigrants | Australia | 0.2 /100 | #266 | Tragic 5.1% |
| Immigrants | Bahamas | 0.2 /100 | #267 | Tragic 5.1% |
| Central American Indians | 0.2 /100 | #268 | Tragic 5.1% |
| Immigrants | Costa Rica | 0.2 /100 | #269 | Tragic 5.1% |
| Immigrants | Iran | 0.1 /100 | #270 | Tragic 5.1% |
| Israelis | 0.1 /100 | #271 | Tragic 5.2% |
| Haitians | 0.1 /100 | #272 | Tragic 5.2% |
| Immigrants | Spain | 0.1 /100 | #273 | Tragic 5.2% |
| Hopi | 0.1 /100 | #274 | Tragic 5.2% |
| Immigrants | Hong Kong | 0.1 /100 | #275 | Tragic 5.2% |
| Central Americans | 0.0 /100 | #276 | Tragic 5.2% |
| Immigrants | Caribbean | 0.0 /100 | #277 | Tragic 5.2% |
| Guatemalans | 0.0 /100 | #278 | Tragic 5.2% |
| Nepalese | 0.0 /100 | #279 | Tragic 5.2% |
| French American Indians | 0.0 /100 | #280 | Tragic 5.2% |
| Immigrants | Haiti | 0.0 /100 | #281 | Tragic 5.2% |
| Mexicans | 0.0 /100 | #282 | Tragic 5.2% |
| Immigrants | Guatemala | 0.0 /100 | #283 | Tragic 5.3% |