Immigrants from Southern Europe vs Peruvian Unemployment Among Ages 60 to 64 years
COMPARE
Immigrants from Southern Europe
Peruvian
Unemployment Among Ages 60 to 64 years
Unemployment Among Ages 60 to 64 years Comparison
Immigrants from Southern Europe
Peruvians
4.8%
UNEMPLOYMENT AMONG AGES 60 TO 64 YEARS
56.7/ 100
METRIC RATING
168th/ 347
METRIC RANK
5.0%
UNEMPLOYMENT AMONG AGES 60 TO 64 YEARS
1.6/ 100
METRIC RATING
244th/ 347
METRIC RANK
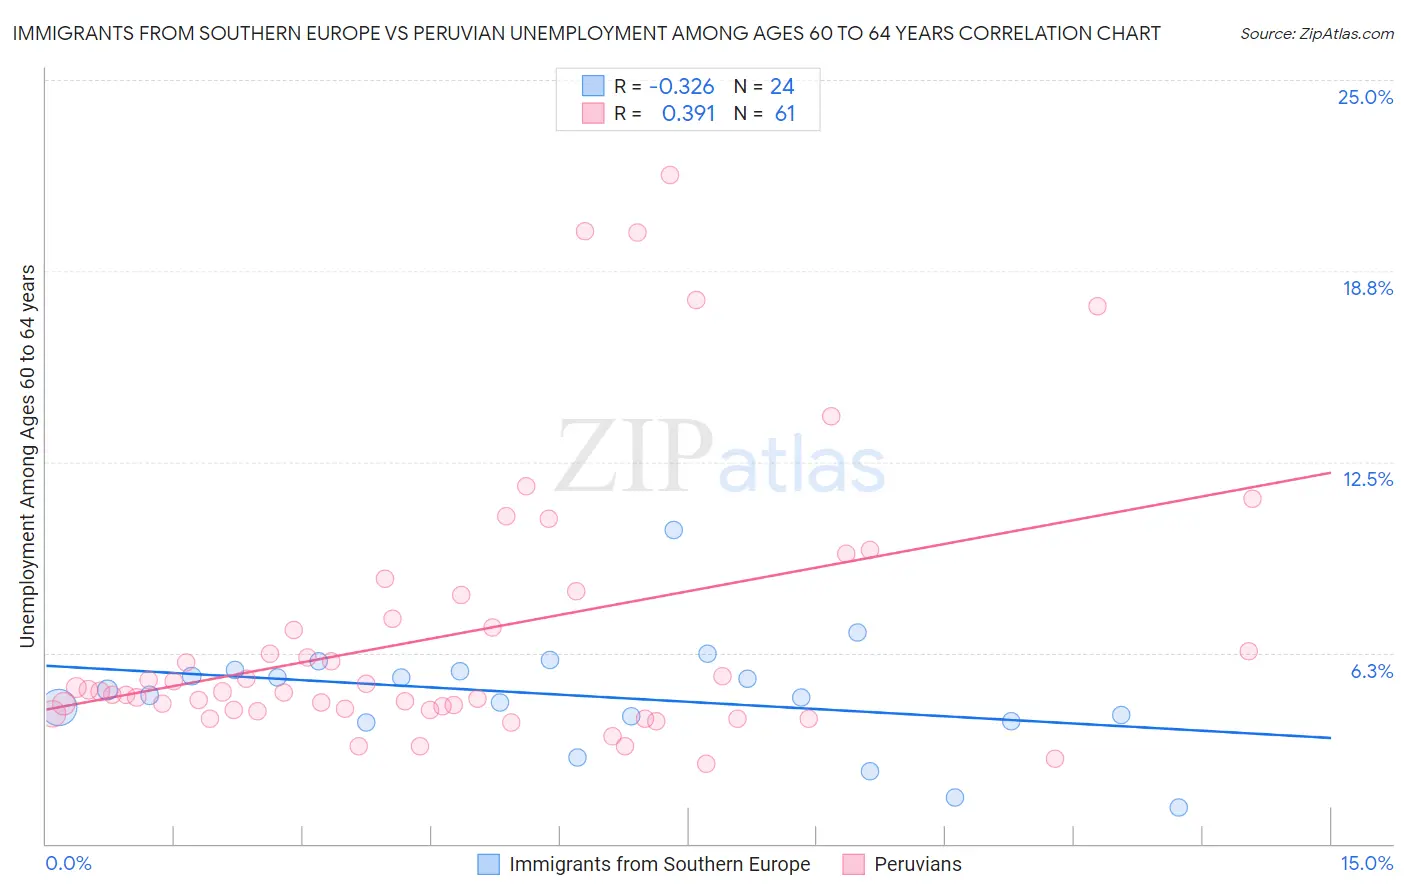
Immigrants from Southern Europe vs Peruvian Unemployment Among Ages 60 to 64 years Correlation Chart
The statistical analysis conducted on geographies consisting of 365,506,927 people shows a mild negative correlation between the proportion of Immigrants from Southern Europe and unemployment rate among population between the ages 60 and 64 in the United States with a correlation coefficient (R) of -0.326 and weighted average of 4.8%. Similarly, the statistical analysis conducted on geographies consisting of 335,688,076 people shows a mild positive correlation between the proportion of Peruvians and unemployment rate among population between the ages 60 and 64 in the United States with a correlation coefficient (R) of 0.391 and weighted average of 5.0%, a difference of 3.9%.
Unemployment Among Ages 60 to 64 years Correlation Summary
| Measurement | Immigrants from Southern Europe | Peruvian |
| Minimum | 1.2% | 2.6% |
| Maximum | 10.3% | 21.9% |
| Range | 9.1% | 19.3% |
| Mean | 4.9% | 6.9% |
| Median | 5.0% | 5.0% |
| Interquartile 25% (IQ1) | 4.1% | 4.4% |
| Interquartile 75% (IQ3) | 5.7% | 7.8% |
| Interquartile Range (IQR) | 1.6% | 3.4% |
| Standard Deviation (Sample) | 1.8% | 4.5% |
| Standard Deviation (Population) | 1.8% | 4.4% |
Similar Demographics by Unemployment Among Ages 60 to 64 years
Demographics Similar to Immigrants from Southern Europe by Unemployment Among Ages 60 to 64 years
In terms of unemployment among ages 60 to 64 years, the demographic groups most similar to Immigrants from Southern Europe are Immigrants from France (4.8%, a difference of 0.040%), Immigrants from Northern Europe (4.8%, a difference of 0.090%), Immigrants from Korea (4.8%, a difference of 0.090%), Samoan (4.9%, a difference of 0.11%), and Palestinian (4.8%, a difference of 0.14%).
| Demographics | Rating | Rank | Unemployment Among Ages 60 to 64 years |
| Immigrants | Norway | 65.1 /100 | #161 | Good 4.8% |
| South Africans | 65.1 /100 | #162 | Good 4.8% |
| Immigrants | Belgium | 64.8 /100 | #163 | Good 4.8% |
| Pakistanis | 64.6 /100 | #164 | Good 4.8% |
| Immigrants | Panama | 62.0 /100 | #165 | Good 4.8% |
| Palestinians | 60.5 /100 | #166 | Good 4.8% |
| Immigrants | Northern Europe | 59.1 /100 | #167 | Average 4.8% |
| Immigrants | Southern Europe | 56.7 /100 | #168 | Average 4.8% |
| Immigrants | France | 55.5 /100 | #169 | Average 4.8% |
| Immigrants | Korea | 54.2 /100 | #170 | Average 4.8% |
| Samoans | 53.6 /100 | #171 | Average 4.9% |
| Immigrants | Turkey | 52.8 /100 | #172 | Average 4.9% |
| Immigrants | Hungary | 50.2 /100 | #173 | Average 4.9% |
| Immigrants | Western Europe | 50.0 /100 | #174 | Average 4.9% |
| Immigrants | Latvia | 46.9 /100 | #175 | Average 4.9% |
Demographics Similar to Peruvians by Unemployment Among Ages 60 to 64 years
In terms of unemployment among ages 60 to 64 years, the demographic groups most similar to Peruvians are Immigrants from Philippines (5.0%, a difference of 0.12%), Comanche (5.0%, a difference of 0.17%), Argentinean (5.0%, a difference of 0.22%), Indian (Asian) (5.0%, a difference of 0.27%), and Immigrants from Croatia (5.0%, a difference of 0.28%).
| Demographics | Rating | Rank | Unemployment Among Ages 60 to 64 years |
| Immigrants | Western Asia | 3.0 /100 | #237 | Tragic 5.0% |
| Immigrants | Poland | 3.0 /100 | #238 | Tragic 5.0% |
| Ghanaians | 2.4 /100 | #239 | Tragic 5.0% |
| Immigrants | Croatia | 2.2 /100 | #240 | Tragic 5.0% |
| Indians (Asian) | 2.2 /100 | #241 | Tragic 5.0% |
| Argentineans | 2.1 /100 | #242 | Tragic 5.0% |
| Immigrants | Philippines | 1.9 /100 | #243 | Tragic 5.0% |
| Peruvians | 1.6 /100 | #244 | Tragic 5.0% |
| Comanche | 1.3 /100 | #245 | Tragic 5.0% |
| Immigrants | South America | 1.1 /100 | #246 | Tragic 5.0% |
| Immigrants | North Macedonia | 1.1 /100 | #247 | Tragic 5.0% |
| Immigrants | Fiji | 1.1 /100 | #248 | Tragic 5.1% |
| South Americans | 1.0 /100 | #249 | Tragic 5.1% |
| Immigrants | Cambodia | 0.9 /100 | #250 | Tragic 5.1% |
| Immigrants | Uruguay | 0.9 /100 | #251 | Tragic 5.1% |