Sierra Leonean vs Korean Unemployment
COMPARE
Sierra Leonean
Korean
Unemployment
Unemployment Comparison
Sierra Leoneans
Koreans
5.8%
UNEMPLOYMENT
0.1/ 100
METRIC RATING
262nd/ 347
METRIC RANK
5.3%
UNEMPLOYMENT
27.4/ 100
METRIC RATING
200th/ 347
METRIC RANK
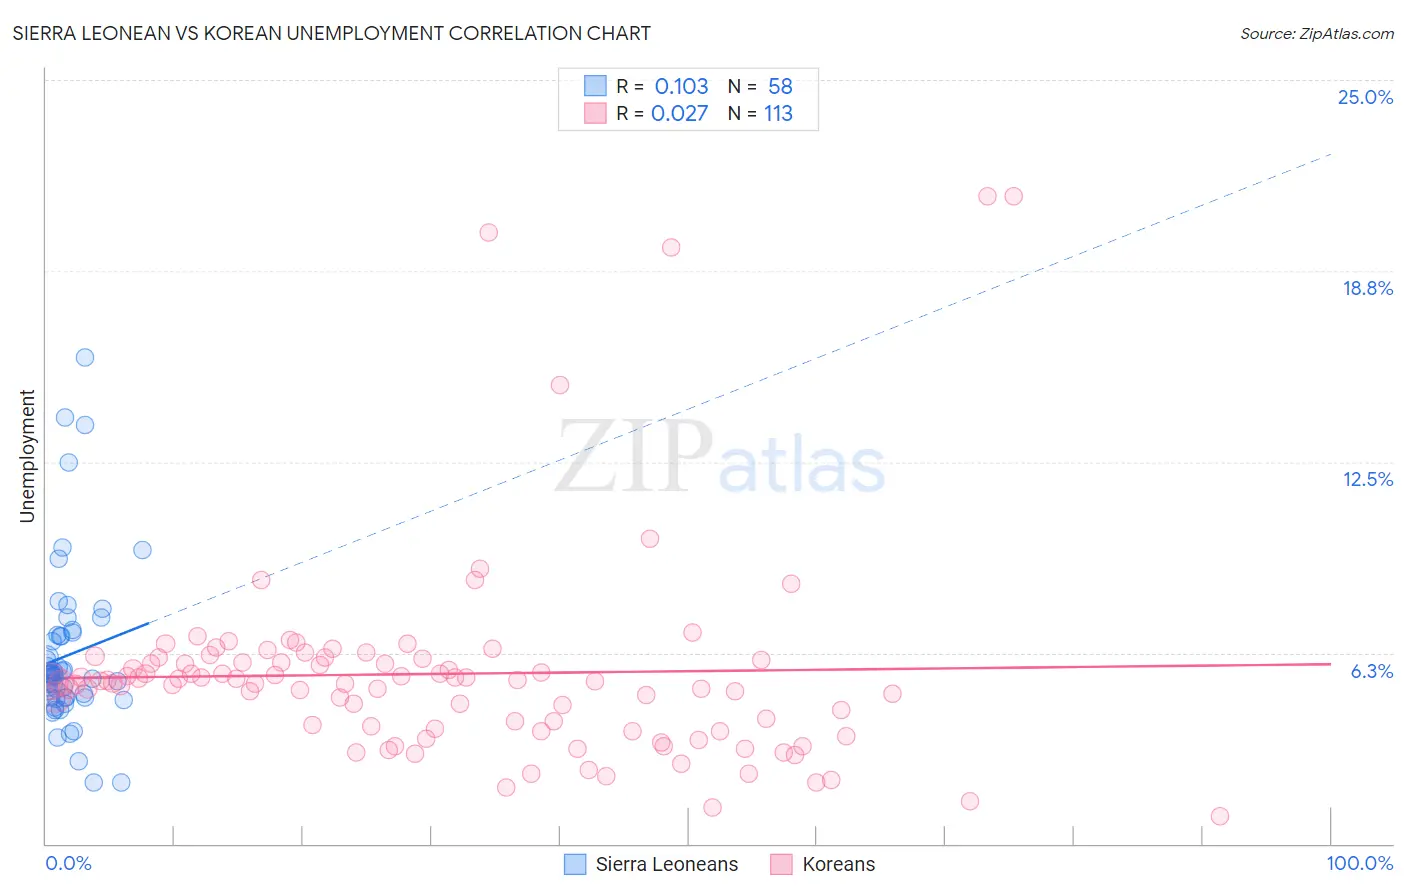
Sierra Leonean vs Korean Unemployment Correlation Chart
The statistical analysis conducted on geographies consisting of 83,351,877 people shows a poor positive correlation between the proportion of Sierra Leoneans and unemployment in the United States with a correlation coefficient (R) of 0.103 and weighted average of 5.8%. Similarly, the statistical analysis conducted on geographies consisting of 509,828,935 people shows no correlation between the proportion of Koreans and unemployment in the United States with a correlation coefficient (R) of 0.027 and weighted average of 5.3%, a difference of 8.7%.
Unemployment Correlation Summary
| Measurement | Sierra Leonean | Korean |
| Minimum | 2.0% | 0.90% |
| Maximum | 15.9% | 21.2% |
| Range | 13.9% | 20.3% |
| Mean | 6.2% | 5.6% |
| Median | 5.5% | 5.3% |
| Interquartile 25% (IQ1) | 4.8% | 3.7% |
| Interquartile 75% (IQ3) | 6.8% | 6.0% |
| Interquartile Range (IQR) | 2.0% | 2.3% |
| Standard Deviation (Sample) | 2.7% | 3.4% |
| Standard Deviation (Population) | 2.7% | 3.4% |
Similar Demographics by Unemployment
Demographics Similar to Sierra Leoneans by Unemployment
In terms of unemployment, the demographic groups most similar to Sierra Leoneans are Salvadoran (5.8%, a difference of 0.030%), Immigrants from Guatemala (5.8%, a difference of 0.10%), Immigrants from Uzbekistan (5.8%, a difference of 0.12%), Immigrants from Liberia (5.8%, a difference of 0.13%), and Subsaharan African (5.8%, a difference of 0.14%).
| Demographics | Rating | Rank | Unemployment |
| Immigrants | Portugal | 0.2 /100 | #255 | Tragic 5.7% |
| Guatemalans | 0.2 /100 | #256 | Tragic 5.8% |
| Yaqui | 0.2 /100 | #257 | Tragic 5.8% |
| Immigrants | Bahamas | 0.1 /100 | #258 | Tragic 5.8% |
| Sub-Saharan Africans | 0.1 /100 | #259 | Tragic 5.8% |
| Immigrants | Uzbekistan | 0.1 /100 | #260 | Tragic 5.8% |
| Immigrants | Guatemala | 0.1 /100 | #261 | Tragic 5.8% |
| Sierra Leoneans | 0.1 /100 | #262 | Tragic 5.8% |
| Salvadorans | 0.1 /100 | #263 | Tragic 5.8% |
| Immigrants | Liberia | 0.1 /100 | #264 | Tragic 5.8% |
| Nigerians | 0.1 /100 | #265 | Tragic 5.8% |
| Mexican American Indians | 0.1 /100 | #266 | Tragic 5.8% |
| Immigrants | Nigeria | 0.1 /100 | #267 | Tragic 5.8% |
| Immigrants | Sierra Leone | 0.1 /100 | #268 | Tragic 5.8% |
| Immigrants | El Salvador | 0.1 /100 | #269 | Tragic 5.8% |
Demographics Similar to Koreans by Unemployment
In terms of unemployment, the demographic groups most similar to Koreans are Immigrants from South Eastern Asia (5.3%, a difference of 0.030%), Immigrants from Israel (5.3%, a difference of 0.090%), Immigrants from Afghanistan (5.3%, a difference of 0.090%), Cherokee (5.3%, a difference of 0.14%), and Immigrants from Micronesia (5.3%, a difference of 0.17%).
| Demographics | Rating | Rank | Unemployment |
| Immigrants | Somalia | 33.8 /100 | #193 | Fair 5.3% |
| Immigrants | Laos | 30.9 /100 | #194 | Fair 5.3% |
| Immigrants | Southern Europe | 30.9 /100 | #195 | Fair 5.3% |
| Peruvians | 29.9 /100 | #196 | Fair 5.3% |
| Immigrants | Uruguay | 29.8 /100 | #197 | Fair 5.3% |
| Immigrants | Israel | 28.6 /100 | #198 | Fair 5.3% |
| Immigrants | Afghanistan | 28.6 /100 | #199 | Fair 5.3% |
| Koreans | 27.4 /100 | #200 | Fair 5.3% |
| Immigrants | South Eastern Asia | 27.0 /100 | #201 | Fair 5.3% |
| Cherokee | 25.5 /100 | #202 | Fair 5.3% |
| Immigrants | Micronesia | 25.2 /100 | #203 | Fair 5.3% |
| Immigrants | Ukraine | 24.9 /100 | #204 | Fair 5.3% |
| Native Hawaiians | 24.1 /100 | #205 | Fair 5.3% |
| Immigrants | Peru | 22.7 /100 | #206 | Fair 5.4% |
| Creek | 19.4 /100 | #207 | Poor 5.4% |