Sierra Leonean vs Korean Householder Income Ages 25 - 44 years
COMPARE
Sierra Leonean
Korean
Householder Income Ages 25 - 44 years
Householder Income Ages 25 - 44 years Comparison
Sierra Leoneans
Koreans
$93,435
HOUSEHOLDER INCOME AGES 25 - 44 YEARS
34.8/ 100
METRIC RATING
186th/ 347
METRIC RANK
$103,824
HOUSEHOLDER INCOME AGES 25 - 44 YEARS
99.4/ 100
METRIC RATING
75th/ 347
METRIC RANK
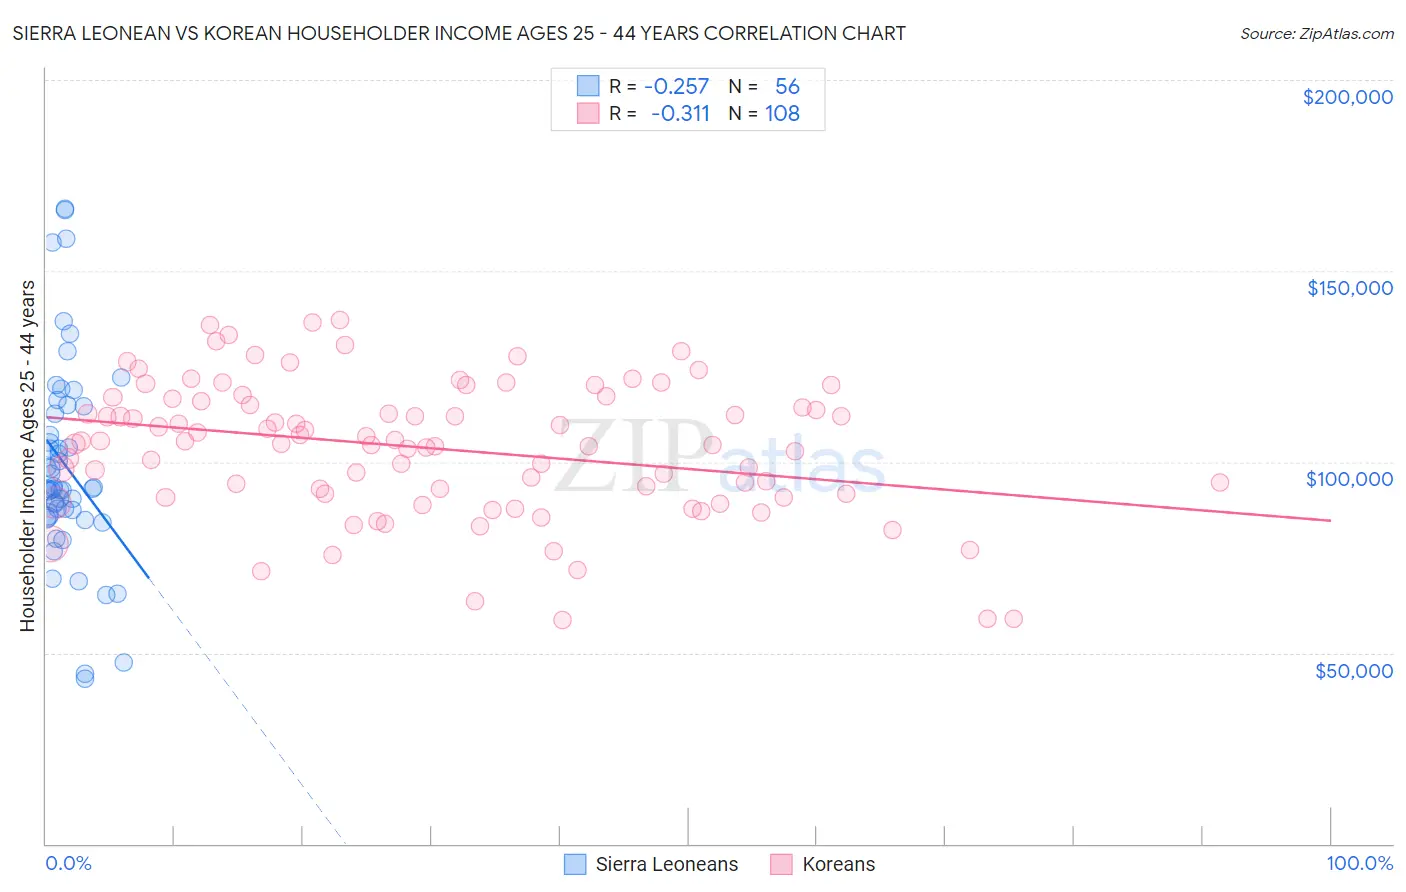
Sierra Leonean vs Korean Householder Income Ages 25 - 44 years Correlation Chart
The statistical analysis conducted on geographies consisting of 83,314,226 people shows a weak negative correlation between the proportion of Sierra Leoneans and household income with householder between the ages 25 and 44 in the United States with a correlation coefficient (R) of -0.257 and weighted average of $93,435. Similarly, the statistical analysis conducted on geographies consisting of 508,598,360 people shows a mild negative correlation between the proportion of Koreans and household income with householder between the ages 25 and 44 in the United States with a correlation coefficient (R) of -0.311 and weighted average of $103,824, a difference of 11.1%.
Householder Income Ages 25 - 44 years Correlation Summary
| Measurement | Sierra Leonean | Korean |
| Minimum | $43,346 | $58,683 |
| Maximum | $166,389 | $137,023 |
| Range | $123,043 | $78,340 |
| Mean | $98,723 | $103,567 |
| Median | $93,030 | $105,054 |
| Interquartile 25% (IQ1) | $85,860 | $91,700 |
| Interquartile 75% (IQ3) | $113,651 | $116,277 |
| Interquartile Range (IQR) | $27,791 | $24,577 |
| Standard Deviation (Sample) | $26,448 | $17,535 |
| Standard Deviation (Population) | $26,211 | $17,454 |
Similar Demographics by Householder Income Ages 25 - 44 years
Demographics Similar to Sierra Leoneans by Householder Income Ages 25 - 44 years
In terms of householder income ages 25 - 44 years, the demographic groups most similar to Sierra Leoneans are Immigrants from Eritrea ($93,466, a difference of 0.030%), Spaniard ($93,366, a difference of 0.070%), German ($93,531, a difference of 0.10%), Guamanian/Chamorro ($93,569, a difference of 0.14%), and Uruguayan ($93,631, a difference of 0.21%).
| Demographics | Rating | Rank | Householder Income Ages 25 - 44 years |
| French Canadians | 38.2 /100 | #179 | Fair $93,694 |
| French | 37.8 /100 | #180 | Fair $93,665 |
| Puget Sound Salish | 37.7 /100 | #181 | Fair $93,661 |
| Uruguayans | 37.3 /100 | #182 | Fair $93,631 |
| Guamanians/Chamorros | 36.5 /100 | #183 | Fair $93,569 |
| Germans | 36.0 /100 | #184 | Fair $93,531 |
| Immigrants | Eritrea | 35.2 /100 | #185 | Fair $93,466 |
| Sierra Leoneans | 34.8 /100 | #186 | Fair $93,435 |
| Spaniards | 34.0 /100 | #187 | Fair $93,366 |
| Immigrants | Sierra Leone | 30.9 /100 | #188 | Fair $93,115 |
| Dutch | 30.5 /100 | #189 | Fair $93,081 |
| Welsh | 30.0 /100 | #190 | Fair $93,039 |
| Tlingit-Haida | 29.4 /100 | #191 | Fair $92,987 |
| Immigrants | Costa Rica | 28.2 /100 | #192 | Fair $92,876 |
| Samoans | 23.0 /100 | #193 | Fair $92,385 |
Demographics Similar to Koreans by Householder Income Ages 25 - 44 years
In terms of householder income ages 25 - 44 years, the demographic groups most similar to Koreans are Immigrants from Spain ($103,752, a difference of 0.070%), Immigrants from Fiji ($103,954, a difference of 0.13%), Immigrants from Southern Europe ($103,486, a difference of 0.33%), Italian ($104,215, a difference of 0.38%), and Immigrants from Bulgaria ($103,423, a difference of 0.39%).
| Demographics | Rating | Rank | Householder Income Ages 25 - 44 years |
| Immigrants | Eastern Europe | 99.6 /100 | #68 | Exceptional $104,662 |
| Mongolians | 99.6 /100 | #69 | Exceptional $104,578 |
| Immigrants | Croatia | 99.6 /100 | #70 | Exceptional $104,503 |
| Afghans | 99.6 /100 | #71 | Exceptional $104,410 |
| Chinese | 99.5 /100 | #72 | Exceptional $104,264 |
| Italians | 99.5 /100 | #73 | Exceptional $104,215 |
| Immigrants | Fiji | 99.5 /100 | #74 | Exceptional $103,954 |
| Koreans | 99.4 /100 | #75 | Exceptional $103,824 |
| Immigrants | Spain | 99.4 /100 | #76 | Exceptional $103,752 |
| Immigrants | Southern Europe | 99.3 /100 | #77 | Exceptional $103,486 |
| Immigrants | Bulgaria | 99.3 /100 | #78 | Exceptional $103,423 |
| Armenians | 99.2 /100 | #79 | Exceptional $103,248 |
| Immigrants | Egypt | 99.2 /100 | #80 | Exceptional $103,192 |
| South Africans | 99.2 /100 | #81 | Exceptional $103,160 |
| Immigrants | Serbia | 99.2 /100 | #82 | Exceptional $103,155 |