Sierra Leonean vs Immigrants from Zaire Unemployment
COMPARE
Sierra Leonean
Immigrants from Zaire
Unemployment
Unemployment Comparison
Sierra Leoneans
Immigrants from Zaire
5.8%
UNEMPLOYMENT
0.1/ 100
METRIC RATING
262nd/ 347
METRIC RANK
5.2%
UNEMPLOYMENT
64.7/ 100
METRIC RATING
163rd/ 347
METRIC RANK
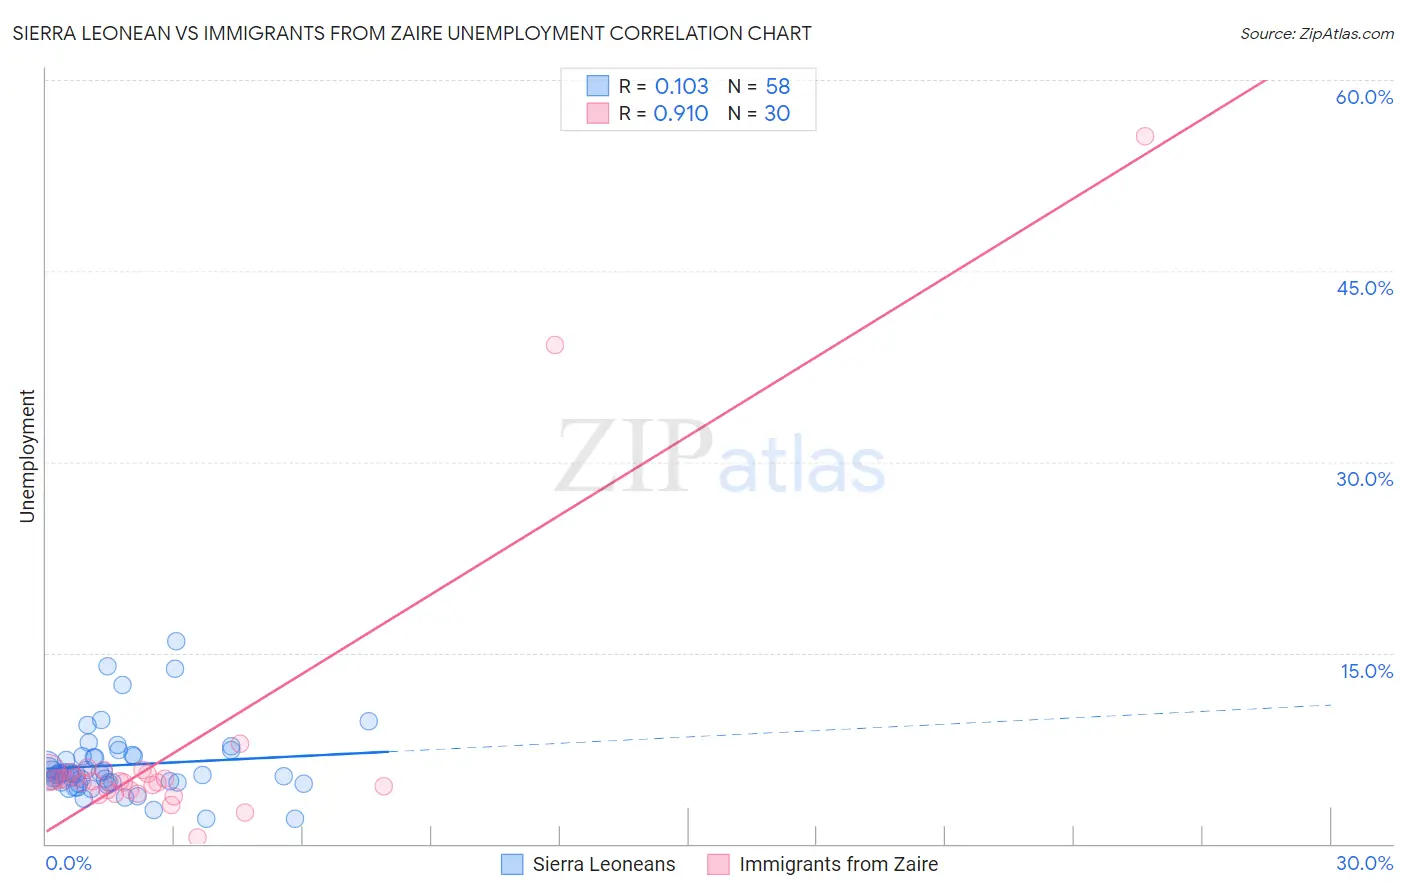
Sierra Leonean vs Immigrants from Zaire Unemployment Correlation Chart
The statistical analysis conducted on geographies consisting of 83,351,877 people shows a poor positive correlation between the proportion of Sierra Leoneans and unemployment in the United States with a correlation coefficient (R) of 0.103 and weighted average of 5.8%. Similarly, the statistical analysis conducted on geographies consisting of 107,241,303 people shows a near-perfect positive correlation between the proportion of Immigrants from Zaire and unemployment in the United States with a correlation coefficient (R) of 0.910 and weighted average of 5.2%, a difference of 11.4%.
Unemployment Correlation Summary
| Measurement | Sierra Leonean | Immigrants from Zaire |
| Minimum | 2.0% | 0.50% |
| Maximum | 15.9% | 55.6% |
| Range | 13.9% | 55.1% |
| Mean | 6.2% | 7.5% |
| Median | 5.5% | 4.9% |
| Interquartile 25% (IQ1) | 4.8% | 4.2% |
| Interquartile 75% (IQ3) | 6.8% | 5.6% |
| Interquartile Range (IQR) | 2.0% | 1.4% |
| Standard Deviation (Sample) | 2.7% | 11.1% |
| Standard Deviation (Population) | 2.7% | 10.9% |
Similar Demographics by Unemployment
Demographics Similar to Sierra Leoneans by Unemployment
In terms of unemployment, the demographic groups most similar to Sierra Leoneans are Salvadoran (5.8%, a difference of 0.030%), Immigrants from Guatemala (5.8%, a difference of 0.10%), Immigrants from Uzbekistan (5.8%, a difference of 0.12%), Immigrants from Liberia (5.8%, a difference of 0.13%), and Subsaharan African (5.8%, a difference of 0.14%).
| Demographics | Rating | Rank | Unemployment |
| Immigrants | Portugal | 0.2 /100 | #255 | Tragic 5.7% |
| Guatemalans | 0.2 /100 | #256 | Tragic 5.8% |
| Yaqui | 0.2 /100 | #257 | Tragic 5.8% |
| Immigrants | Bahamas | 0.1 /100 | #258 | Tragic 5.8% |
| Sub-Saharan Africans | 0.1 /100 | #259 | Tragic 5.8% |
| Immigrants | Uzbekistan | 0.1 /100 | #260 | Tragic 5.8% |
| Immigrants | Guatemala | 0.1 /100 | #261 | Tragic 5.8% |
| Sierra Leoneans | 0.1 /100 | #262 | Tragic 5.8% |
| Salvadorans | 0.1 /100 | #263 | Tragic 5.8% |
| Immigrants | Liberia | 0.1 /100 | #264 | Tragic 5.8% |
| Nigerians | 0.1 /100 | #265 | Tragic 5.8% |
| Mexican American Indians | 0.1 /100 | #266 | Tragic 5.8% |
| Immigrants | Nigeria | 0.1 /100 | #267 | Tragic 5.8% |
| Immigrants | Sierra Leone | 0.1 /100 | #268 | Tragic 5.8% |
| Immigrants | El Salvador | 0.1 /100 | #269 | Tragic 5.8% |
Demographics Similar to Immigrants from Zaire by Unemployment
In terms of unemployment, the demographic groups most similar to Immigrants from Zaire are Immigrants from Colombia (5.2%, a difference of 0.0%), Spanish (5.2%, a difference of 0.020%), Immigrants from Oceania (5.2%, a difference of 0.030%), Laotian (5.2%, a difference of 0.11%), and Immigrants from Brazil (5.2%, a difference of 0.11%).
| Demographics | Rating | Rank | Unemployment |
| Immigrants | Kazakhstan | 70.4 /100 | #156 | Good 5.2% |
| Sri Lankans | 69.5 /100 | #157 | Good 5.2% |
| Immigrants | Egypt | 66.7 /100 | #158 | Good 5.2% |
| Immigrants | Russia | 66.6 /100 | #159 | Good 5.2% |
| Laotians | 66.3 /100 | #160 | Good 5.2% |
| Immigrants | Oceania | 65.2 /100 | #161 | Good 5.2% |
| Spanish | 65.1 /100 | #162 | Good 5.2% |
| Immigrants | Zaire | 64.7 /100 | #163 | Good 5.2% |
| Immigrants | Colombia | 64.7 /100 | #164 | Good 5.2% |
| Immigrants | Brazil | 63.1 /100 | #165 | Good 5.2% |
| Immigrants | Indonesia | 61.2 /100 | #166 | Good 5.2% |
| Colombians | 61.1 /100 | #167 | Good 5.2% |
| Uruguayans | 60.2 /100 | #168 | Good 5.2% |
| Immigrants | Morocco | 59.1 /100 | #169 | Average 5.2% |
| Immigrants | Nicaragua | 57.1 /100 | #170 | Average 5.2% |