Immigrants from Colombia vs Korean Unemployment
COMPARE
Immigrants from Colombia
Korean
Unemployment
Unemployment Comparison
Immigrants from Colombia
Koreans
5.2%
UNEMPLOYMENT
64.7/ 100
METRIC RATING
164th/ 347
METRIC RANK
5.3%
UNEMPLOYMENT
27.4/ 100
METRIC RATING
200th/ 347
METRIC RANK
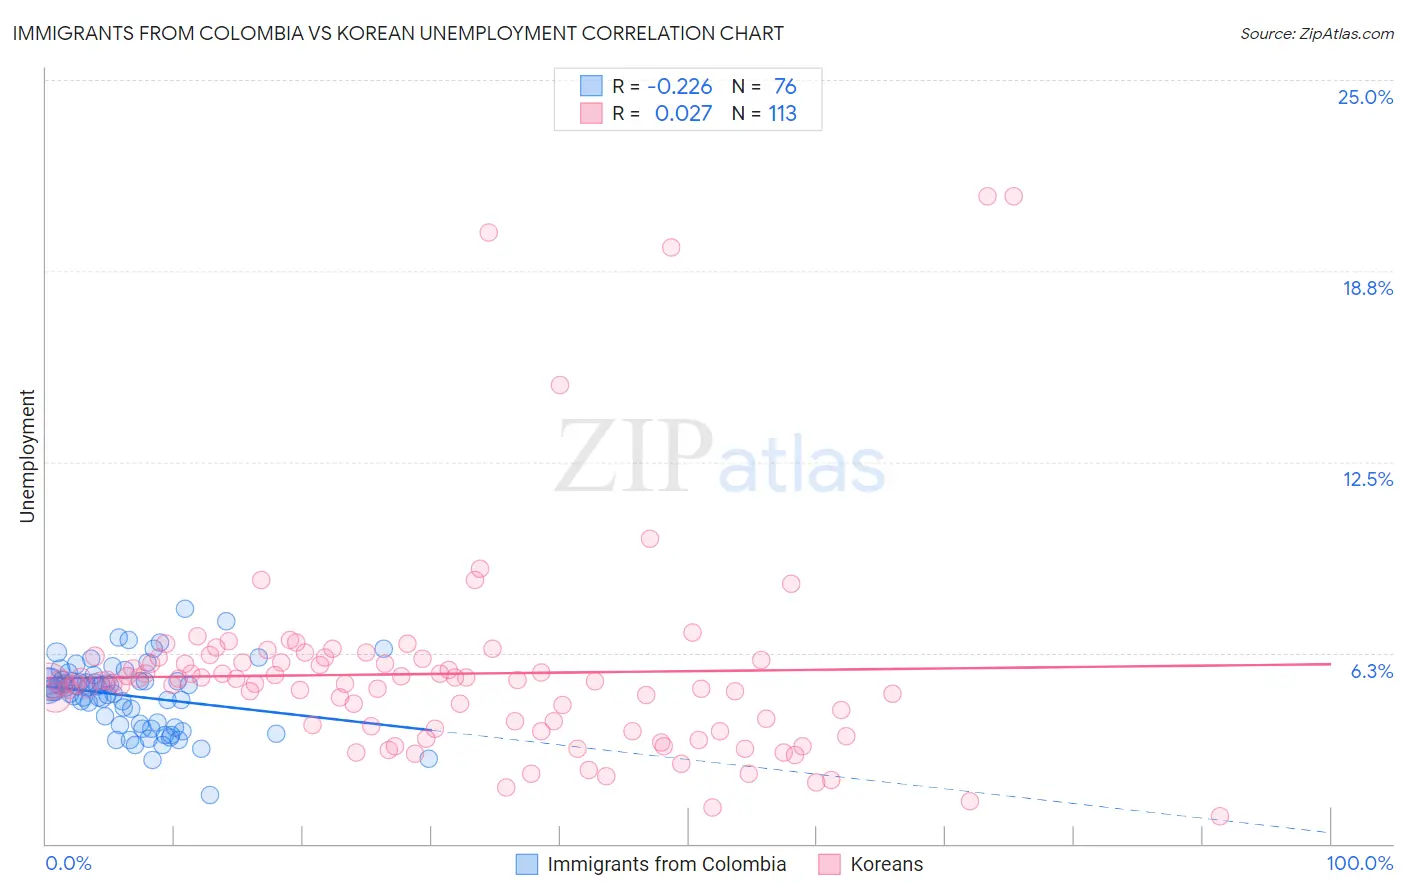
Immigrants from Colombia vs Korean Unemployment Correlation Chart
The statistical analysis conducted on geographies consisting of 378,436,728 people shows a weak negative correlation between the proportion of Immigrants from Colombia and unemployment in the United States with a correlation coefficient (R) of -0.226 and weighted average of 5.2%. Similarly, the statistical analysis conducted on geographies consisting of 509,828,935 people shows no correlation between the proportion of Koreans and unemployment in the United States with a correlation coefficient (R) of 0.027 and weighted average of 5.3%, a difference of 2.5%.
Unemployment Correlation Summary
| Measurement | Immigrants from Colombia | Korean |
| Minimum | 1.6% | 0.90% |
| Maximum | 7.7% | 21.2% |
| Range | 6.1% | 20.3% |
| Mean | 4.8% | 5.6% |
| Median | 5.0% | 5.3% |
| Interquartile 25% (IQ1) | 3.9% | 3.7% |
| Interquartile 75% (IQ3) | 5.3% | 6.0% |
| Interquartile Range (IQR) | 1.4% | 2.3% |
| Standard Deviation (Sample) | 1.1% | 3.4% |
| Standard Deviation (Population) | 1.1% | 3.4% |
Similar Demographics by Unemployment
Demographics Similar to Immigrants from Colombia by Unemployment
In terms of unemployment, the demographic groups most similar to Immigrants from Colombia are Immigrants from Zaire (5.2%, a difference of 0.0%), Spanish (5.2%, a difference of 0.030%), Immigrants from Oceania (5.2%, a difference of 0.040%), Laotian (5.2%, a difference of 0.11%), and Immigrants from Brazil (5.2%, a difference of 0.11%).
| Demographics | Rating | Rank | Unemployment |
| Sri Lankans | 69.5 /100 | #157 | Good 5.2% |
| Immigrants | Egypt | 66.7 /100 | #158 | Good 5.2% |
| Immigrants | Russia | 66.6 /100 | #159 | Good 5.2% |
| Laotians | 66.3 /100 | #160 | Good 5.2% |
| Immigrants | Oceania | 65.2 /100 | #161 | Good 5.2% |
| Spanish | 65.1 /100 | #162 | Good 5.2% |
| Immigrants | Zaire | 64.7 /100 | #163 | Good 5.2% |
| Immigrants | Colombia | 64.7 /100 | #164 | Good 5.2% |
| Immigrants | Brazil | 63.1 /100 | #165 | Good 5.2% |
| Immigrants | Indonesia | 61.2 /100 | #166 | Good 5.2% |
| Colombians | 61.1 /100 | #167 | Good 5.2% |
| Uruguayans | 60.2 /100 | #168 | Good 5.2% |
| Immigrants | Morocco | 59.1 /100 | #169 | Average 5.2% |
| Immigrants | Nicaragua | 57.1 /100 | #170 | Average 5.2% |
| Puget Sound Salish | 56.6 /100 | #171 | Average 5.2% |
Demographics Similar to Koreans by Unemployment
In terms of unemployment, the demographic groups most similar to Koreans are Immigrants from South Eastern Asia (5.3%, a difference of 0.030%), Immigrants from Israel (5.3%, a difference of 0.090%), Immigrants from Afghanistan (5.3%, a difference of 0.090%), Cherokee (5.3%, a difference of 0.14%), and Immigrants from Micronesia (5.3%, a difference of 0.17%).
| Demographics | Rating | Rank | Unemployment |
| Immigrants | Somalia | 33.8 /100 | #193 | Fair 5.3% |
| Immigrants | Laos | 30.9 /100 | #194 | Fair 5.3% |
| Immigrants | Southern Europe | 30.9 /100 | #195 | Fair 5.3% |
| Peruvians | 29.9 /100 | #196 | Fair 5.3% |
| Immigrants | Uruguay | 29.8 /100 | #197 | Fair 5.3% |
| Immigrants | Israel | 28.6 /100 | #198 | Fair 5.3% |
| Immigrants | Afghanistan | 28.6 /100 | #199 | Fair 5.3% |
| Koreans | 27.4 /100 | #200 | Fair 5.3% |
| Immigrants | South Eastern Asia | 27.0 /100 | #201 | Fair 5.3% |
| Cherokee | 25.5 /100 | #202 | Fair 5.3% |
| Immigrants | Micronesia | 25.2 /100 | #203 | Fair 5.3% |
| Immigrants | Ukraine | 24.9 /100 | #204 | Fair 5.3% |
| Native Hawaiians | 24.1 /100 | #205 | Fair 5.3% |
| Immigrants | Peru | 22.7 /100 | #206 | Fair 5.4% |
| Creek | 19.4 /100 | #207 | Poor 5.4% |