Afghan vs Korean Unemployment
COMPARE
Afghan
Korean
Unemployment
Unemployment Comparison
Afghans
Koreans
5.3%
UNEMPLOYMENT
47.4/ 100
METRIC RATING
178th/ 347
METRIC RANK
5.3%
UNEMPLOYMENT
27.4/ 100
METRIC RATING
200th/ 347
METRIC RANK
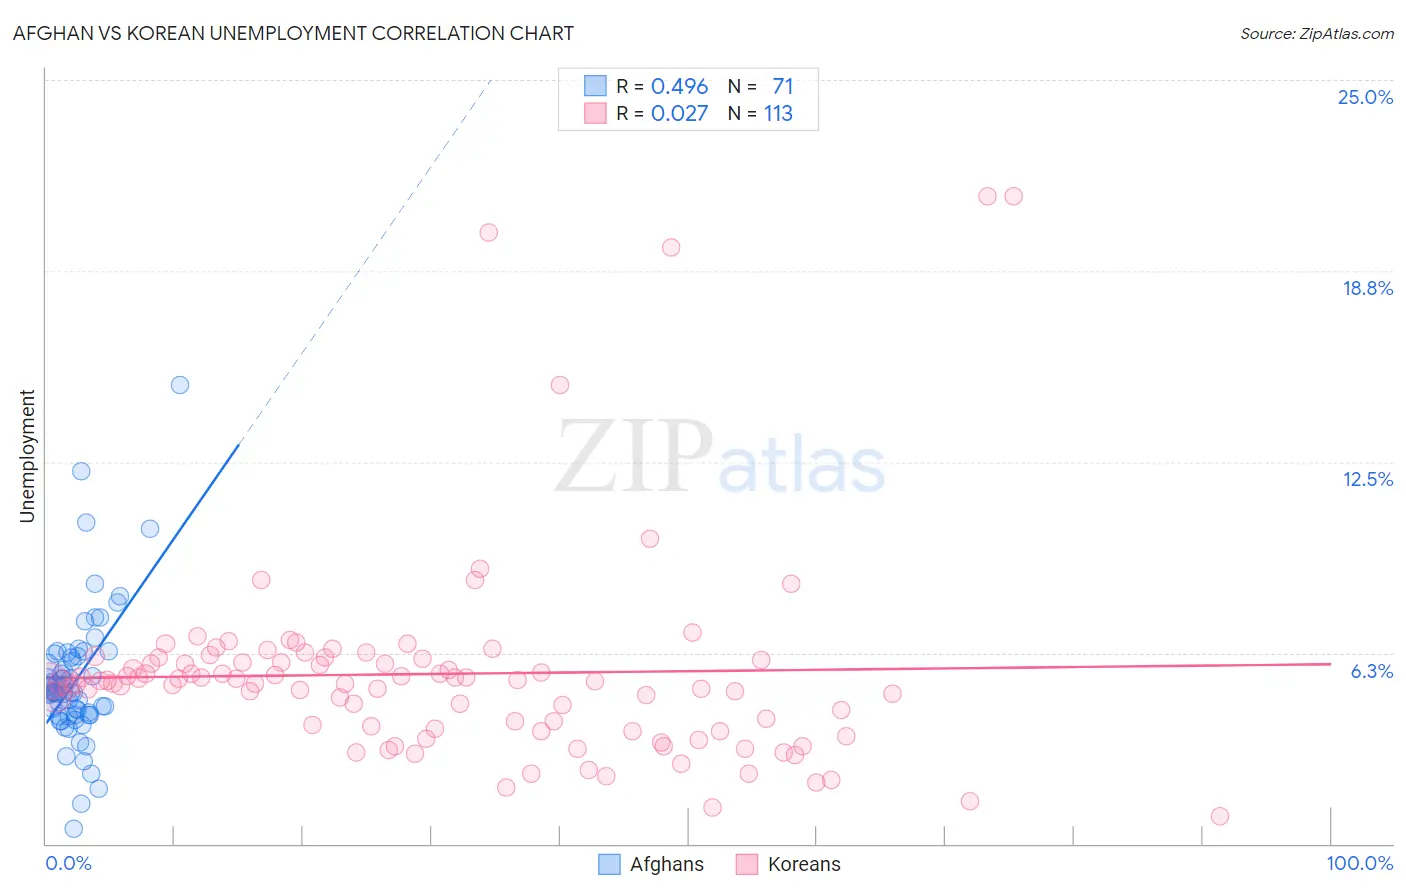
Afghan vs Korean Unemployment Correlation Chart
The statistical analysis conducted on geographies consisting of 148,850,223 people shows a moderate positive correlation between the proportion of Afghans and unemployment in the United States with a correlation coefficient (R) of 0.496 and weighted average of 5.3%. Similarly, the statistical analysis conducted on geographies consisting of 509,828,935 people shows no correlation between the proportion of Koreans and unemployment in the United States with a correlation coefficient (R) of 0.027 and weighted average of 5.3%, a difference of 1.3%.
Unemployment Correlation Summary
| Measurement | Afghan | Korean |
| Minimum | 0.50% | 0.90% |
| Maximum | 15.0% | 21.2% |
| Range | 14.5% | 20.3% |
| Mean | 5.3% | 5.6% |
| Median | 5.0% | 5.3% |
| Interquartile 25% (IQ1) | 4.2% | 3.7% |
| Interquartile 75% (IQ3) | 6.2% | 6.0% |
| Interquartile Range (IQR) | 2.0% | 2.3% |
| Standard Deviation (Sample) | 2.2% | 3.4% |
| Standard Deviation (Population) | 2.2% | 3.4% |
Similar Demographics by Unemployment
Demographics Similar to Afghans by Unemployment
In terms of unemployment, the demographic groups most similar to Afghans are Nonimmigrants (5.3%, a difference of 0.030%), Malaysian (5.3%, a difference of 0.030%), Nicaraguan (5.3%, a difference of 0.080%), Taiwanese (5.3%, a difference of 0.14%), and Immigrants from Greece (5.3%, a difference of 0.15%).
| Demographics | Rating | Rank | Unemployment |
| Puget Sound Salish | 56.6 /100 | #171 | Average 5.2% |
| Immigrants | Vietnam | 52.5 /100 | #172 | Average 5.2% |
| Immigrants | Poland | 51.8 /100 | #173 | Average 5.3% |
| Immigrants | Congo | 50.0 /100 | #174 | Average 5.3% |
| Taiwanese | 49.6 /100 | #175 | Average 5.3% |
| Nicaraguans | 48.7 /100 | #176 | Average 5.3% |
| Immigrants | Nonimmigrants | 47.9 /100 | #177 | Average 5.3% |
| Afghans | 47.4 /100 | #178 | Average 5.3% |
| Malaysians | 46.8 /100 | #179 | Average 5.3% |
| Immigrants | Greece | 45.0 /100 | #180 | Average 5.3% |
| Albanians | 43.5 /100 | #181 | Average 5.3% |
| Spaniards | 42.2 /100 | #182 | Average 5.3% |
| Brazilians | 40.2 /100 | #183 | Average 5.3% |
| Assyrians/Chaldeans/Syriacs | 39.2 /100 | #184 | Fair 5.3% |
| Immigrants | Thailand | 38.9 /100 | #185 | Fair 5.3% |
Demographics Similar to Koreans by Unemployment
In terms of unemployment, the demographic groups most similar to Koreans are Immigrants from South Eastern Asia (5.3%, a difference of 0.030%), Immigrants from Israel (5.3%, a difference of 0.090%), Immigrants from Afghanistan (5.3%, a difference of 0.090%), Cherokee (5.3%, a difference of 0.14%), and Immigrants from Micronesia (5.3%, a difference of 0.17%).
| Demographics | Rating | Rank | Unemployment |
| Immigrants | Somalia | 33.8 /100 | #193 | Fair 5.3% |
| Immigrants | Laos | 30.9 /100 | #194 | Fair 5.3% |
| Immigrants | Southern Europe | 30.9 /100 | #195 | Fair 5.3% |
| Peruvians | 29.9 /100 | #196 | Fair 5.3% |
| Immigrants | Uruguay | 29.8 /100 | #197 | Fair 5.3% |
| Immigrants | Israel | 28.6 /100 | #198 | Fair 5.3% |
| Immigrants | Afghanistan | 28.6 /100 | #199 | Fair 5.3% |
| Koreans | 27.4 /100 | #200 | Fair 5.3% |
| Immigrants | South Eastern Asia | 27.0 /100 | #201 | Fair 5.3% |
| Cherokee | 25.5 /100 | #202 | Fair 5.3% |
| Immigrants | Micronesia | 25.2 /100 | #203 | Fair 5.3% |
| Immigrants | Ukraine | 24.9 /100 | #204 | Fair 5.3% |
| Native Hawaiians | 24.1 /100 | #205 | Fair 5.3% |
| Immigrants | Peru | 22.7 /100 | #206 | Fair 5.4% |
| Creek | 19.4 /100 | #207 | Poor 5.4% |