Shoshone vs Immigrants from Bosnia and Herzegovina Unemployment Among Women with Children Under 6 years
COMPARE
Shoshone
Immigrants from Bosnia and Herzegovina
Unemployment Among Women with Children Under 6 years
Unemployment Among Women with Children Under 6 years Comparison
Shoshone
Immigrants from Bosnia and Herzegovina
13.2%
UNEMPLOYMENT AMONG WOMEN WITH CHILDREN UNDER 6 YEARS
0.0/ 100
METRIC RATING
336th/ 347
METRIC RANK
7.3%
UNEMPLOYMENT AMONG WOMEN WITH CHILDREN UNDER 6 YEARS
93.5/ 100
METRIC RATING
122nd/ 347
METRIC RANK
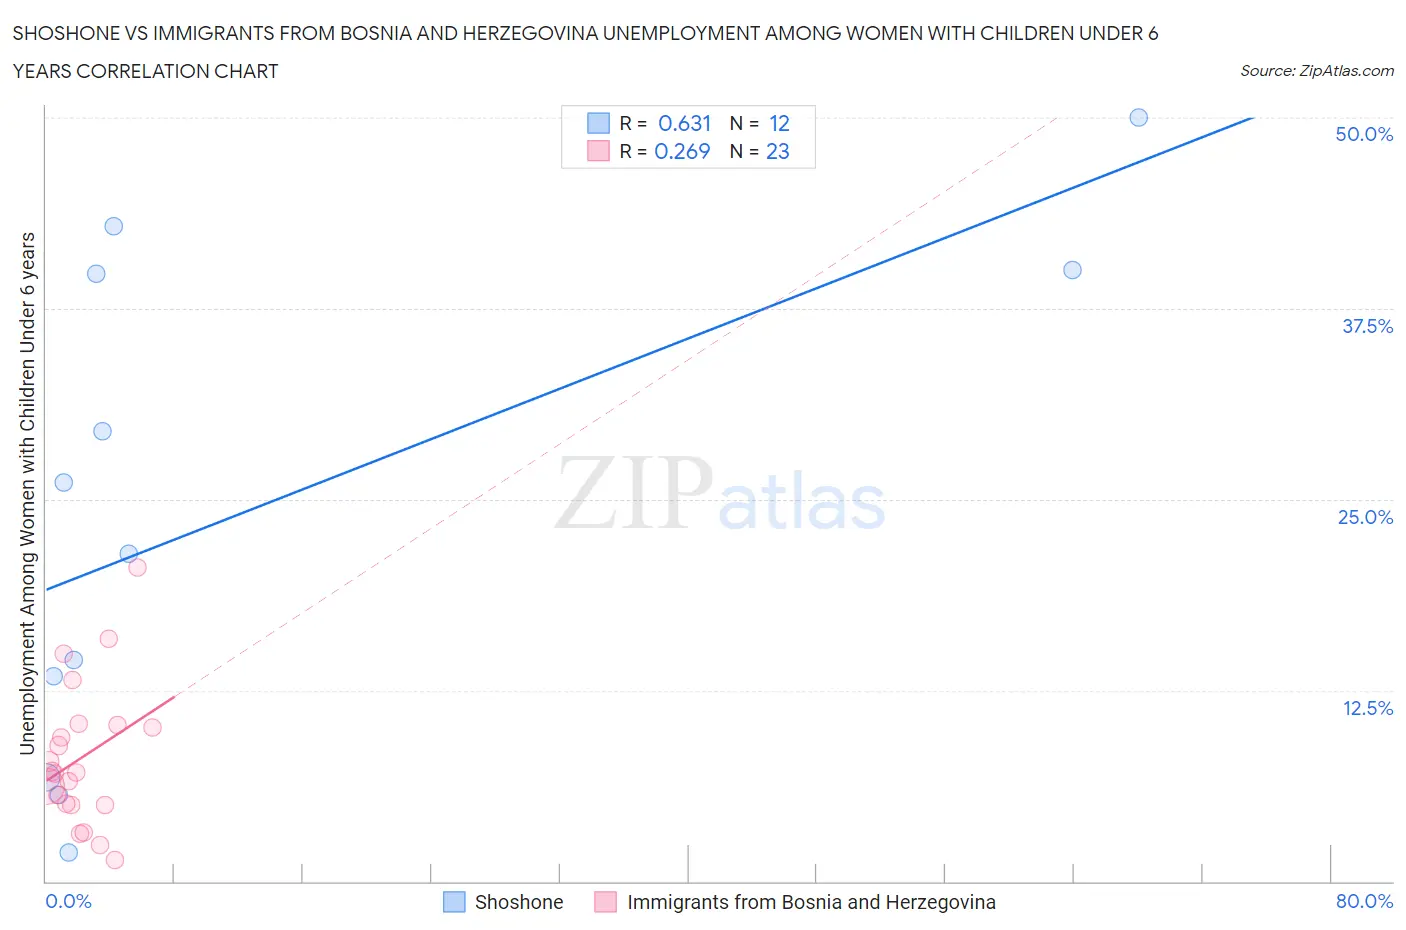
Shoshone vs Immigrants from Bosnia and Herzegovina Unemployment Among Women with Children Under 6 years Correlation Chart
The statistical analysis conducted on geographies consisting of 60,930,865 people shows a significant positive correlation between the proportion of Shoshone and unemployment rate among women with children under the age of 6 in the United States with a correlation coefficient (R) of 0.631 and weighted average of 13.2%. Similarly, the statistical analysis conducted on geographies consisting of 133,857,807 people shows a weak positive correlation between the proportion of Immigrants from Bosnia and Herzegovina and unemployment rate among women with children under the age of 6 in the United States with a correlation coefficient (R) of 0.269 and weighted average of 7.3%, a difference of 80.4%.
Unemployment Among Women with Children Under 6 years Correlation Summary
| Measurement | Shoshone | Immigrants from Bosnia and Herzegovina |
| Minimum | 1.9% | 1.4% |
| Maximum | 50.0% | 20.5% |
| Range | 48.1% | 19.1% |
| Mean | 24.3% | 8.1% |
| Median | 23.8% | 7.1% |
| Interquartile 25% (IQ1) | 10.1% | 5.0% |
| Interquartile 75% (IQ3) | 39.9% | 10.2% |
| Interquartile Range (IQR) | 29.8% | 5.2% |
| Standard Deviation (Sample) | 16.2% | 4.6% |
| Standard Deviation (Population) | 15.5% | 4.5% |
Similar Demographics by Unemployment Among Women with Children Under 6 years
Demographics Similar to Shoshone by Unemployment Among Women with Children Under 6 years
In terms of unemployment among women with children under 6 years, the demographic groups most similar to Shoshone are Chippewa (13.3%, a difference of 1.1%), Pima (13.4%, a difference of 1.9%), Navajo (13.5%, a difference of 2.3%), Immigrants from Yemen (13.5%, a difference of 2.3%), and Lumbee (13.8%, a difference of 4.6%).
| Demographics | Rating | Rank | Unemployment Among Women with Children Under 6 years |
| Blacks/African Americans | 0.0 /100 | #329 | Tragic 10.3% |
| Pennsylvania Germans | 0.0 /100 | #330 | Tragic 10.8% |
| Colville | 0.0 /100 | #331 | Tragic 11.2% |
| Sioux | 0.0 /100 | #332 | Tragic 11.5% |
| Natives/Alaskans | 0.0 /100 | #333 | Tragic 11.5% |
| Apache | 0.0 /100 | #334 | Tragic 12.3% |
| Puerto Ricans | 0.0 /100 | #335 | Tragic 12.5% |
| Shoshone | 0.0 /100 | #336 | Tragic 13.2% |
| Chippewa | 0.0 /100 | #337 | Tragic 13.3% |
| Pima | 0.0 /100 | #338 | Tragic 13.4% |
| Navajo | 0.0 /100 | #339 | Tragic 13.5% |
| Immigrants | Yemen | 0.0 /100 | #340 | Tragic 13.5% |
| Lumbee | 0.0 /100 | #341 | Tragic 13.8% |
| Yuman | 0.0 /100 | #342 | Tragic 14.6% |
| Crow | 0.0 /100 | #343 | Tragic 14.6% |
Demographics Similar to Immigrants from Bosnia and Herzegovina by Unemployment Among Women with Children Under 6 years
In terms of unemployment among women with children under 6 years, the demographic groups most similar to Immigrants from Bosnia and Herzegovina are Immigrants from Chile (7.3%, a difference of 0.010%), Immigrants from Zaire (7.3%, a difference of 0.050%), Iraqi (7.3%, a difference of 0.13%), South African (7.3%, a difference of 0.20%), and Immigrants from South Africa (7.3%, a difference of 0.25%).
| Demographics | Rating | Rank | Unemployment Among Women with Children Under 6 years |
| Immigrants | Italy | 96.1 /100 | #115 | Exceptional 7.2% |
| Armenians | 95.9 /100 | #116 | Exceptional 7.2% |
| Immigrants | Kenya | 95.4 /100 | #117 | Exceptional 7.3% |
| Serbians | 94.5 /100 | #118 | Exceptional 7.3% |
| South Africans | 94.1 /100 | #119 | Exceptional 7.3% |
| Iraqis | 93.9 /100 | #120 | Exceptional 7.3% |
| Immigrants | Chile | 93.5 /100 | #121 | Exceptional 7.3% |
| Immigrants | Bosnia and Herzegovina | 93.5 /100 | #122 | Exceptional 7.3% |
| Immigrants | Zaire | 93.3 /100 | #123 | Exceptional 7.3% |
| Immigrants | South Africa | 92.5 /100 | #124 | Exceptional 7.3% |
| Pakistanis | 92.2 /100 | #125 | Exceptional 7.3% |
| Immigrants | Burma/Myanmar | 91.9 /100 | #126 | Exceptional 7.3% |
| Jordanians | 91.5 /100 | #127 | Exceptional 7.3% |
| Zimbabweans | 91.5 /100 | #128 | Exceptional 7.3% |
| Slovenes | 89.2 /100 | #129 | Excellent 7.4% |