Shoshone vs Celtic Unemployment Among Women with Children Under 6 years
COMPARE
Shoshone
Celtic
Unemployment Among Women with Children Under 6 years
Unemployment Among Women with Children Under 6 years Comparison
Shoshone
Celtics
13.2%
UNEMPLOYMENT AMONG WOMEN WITH CHILDREN UNDER 6 YEARS
0.0/ 100
METRIC RATING
336th/ 347
METRIC RANK
8.3%
UNEMPLOYMENT AMONG WOMEN WITH CHILDREN UNDER 6 YEARS
0.6/ 100
METRIC RATING
256th/ 347
METRIC RANK
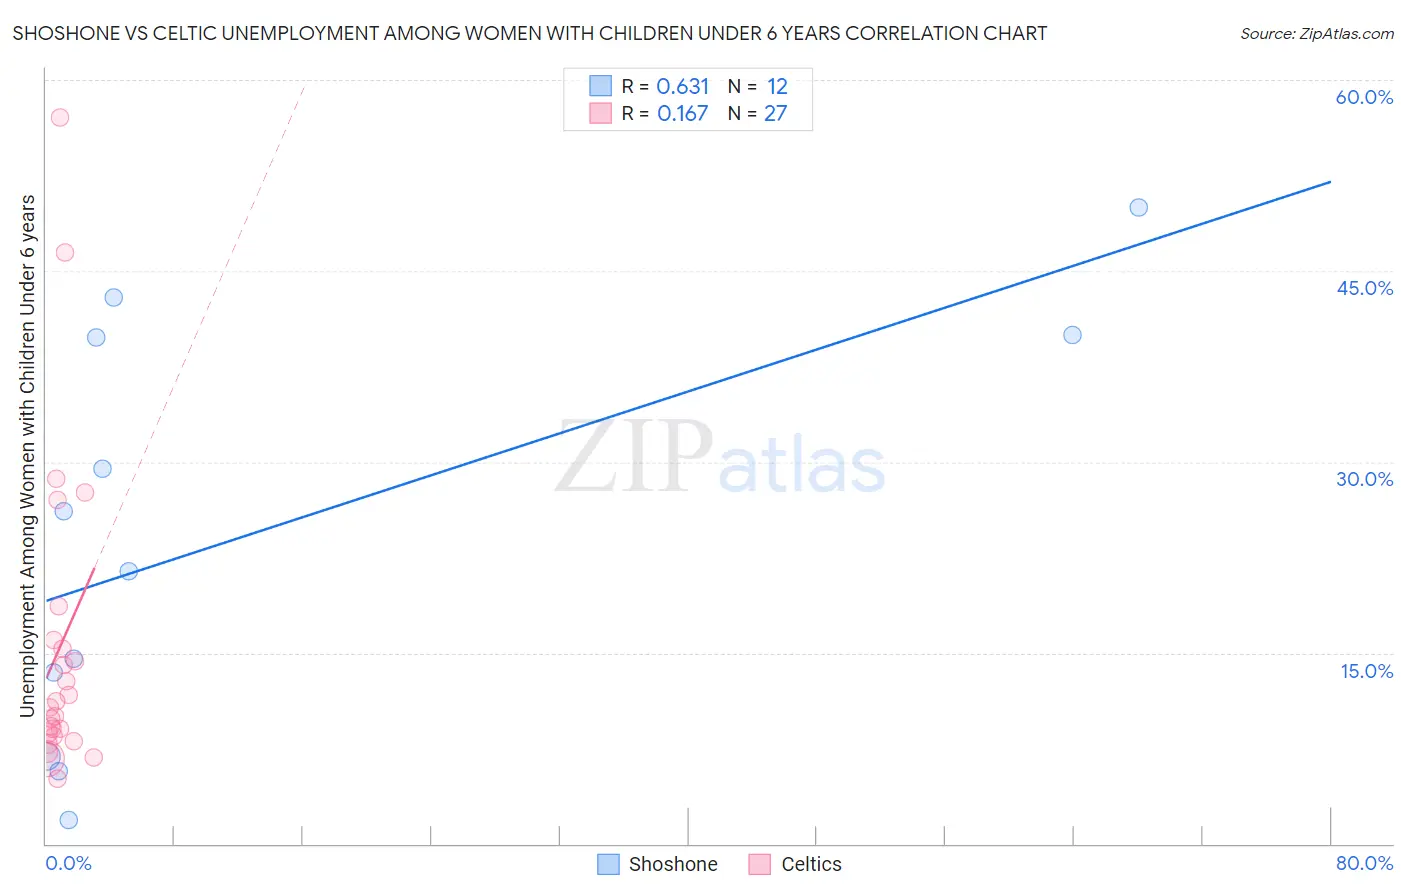
Shoshone vs Celtic Unemployment Among Women with Children Under 6 years Correlation Chart
The statistical analysis conducted on geographies consisting of 60,930,865 people shows a significant positive correlation between the proportion of Shoshone and unemployment rate among women with children under the age of 6 in the United States with a correlation coefficient (R) of 0.631 and weighted average of 13.2%. Similarly, the statistical analysis conducted on geographies consisting of 142,115,013 people shows a poor positive correlation between the proportion of Celtics and unemployment rate among women with children under the age of 6 in the United States with a correlation coefficient (R) of 0.167 and weighted average of 8.3%, a difference of 58.9%.
Unemployment Among Women with Children Under 6 years Correlation Summary
| Measurement | Shoshone | Celtic |
| Minimum | 1.9% | 5.1% |
| Maximum | 50.0% | 57.1% |
| Range | 48.1% | 52.0% |
| Mean | 24.3% | 15.5% |
| Median | 23.8% | 10.7% |
| Interquartile 25% (IQ1) | 10.1% | 8.5% |
| Interquartile 75% (IQ3) | 39.9% | 16.0% |
| Interquartile Range (IQR) | 29.8% | 7.5% |
| Standard Deviation (Sample) | 16.2% | 12.3% |
| Standard Deviation (Population) | 15.5% | 12.1% |
Similar Demographics by Unemployment Among Women with Children Under 6 years
Demographics Similar to Shoshone by Unemployment Among Women with Children Under 6 years
In terms of unemployment among women with children under 6 years, the demographic groups most similar to Shoshone are Chippewa (13.3%, a difference of 1.1%), Pima (13.4%, a difference of 1.9%), Navajo (13.5%, a difference of 2.3%), Immigrants from Yemen (13.5%, a difference of 2.3%), and Lumbee (13.8%, a difference of 4.6%).
| Demographics | Rating | Rank | Unemployment Among Women with Children Under 6 years |
| Blacks/African Americans | 0.0 /100 | #329 | Tragic 10.3% |
| Pennsylvania Germans | 0.0 /100 | #330 | Tragic 10.8% |
| Colville | 0.0 /100 | #331 | Tragic 11.2% |
| Sioux | 0.0 /100 | #332 | Tragic 11.5% |
| Natives/Alaskans | 0.0 /100 | #333 | Tragic 11.5% |
| Apache | 0.0 /100 | #334 | Tragic 12.3% |
| Puerto Ricans | 0.0 /100 | #335 | Tragic 12.5% |
| Shoshone | 0.0 /100 | #336 | Tragic 13.2% |
| Chippewa | 0.0 /100 | #337 | Tragic 13.3% |
| Pima | 0.0 /100 | #338 | Tragic 13.4% |
| Navajo | 0.0 /100 | #339 | Tragic 13.5% |
| Immigrants | Yemen | 0.0 /100 | #340 | Tragic 13.5% |
| Lumbee | 0.0 /100 | #341 | Tragic 13.8% |
| Yuman | 0.0 /100 | #342 | Tragic 14.6% |
| Crow | 0.0 /100 | #343 | Tragic 14.6% |
Demographics Similar to Celtics by Unemployment Among Women with Children Under 6 years
In terms of unemployment among women with children under 6 years, the demographic groups most similar to Celtics are Immigrants from Portugal (8.3%, a difference of 0.020%), British West Indian (8.3%, a difference of 0.26%), Immigrants from Ghana (8.3%, a difference of 0.28%), Immigrants from Caribbean (8.3%, a difference of 0.31%), and Immigrants from Guyana (8.2%, a difference of 0.57%).
| Demographics | Rating | Rank | Unemployment Among Women with Children Under 6 years |
| Immigrants | Sierra Leone | 1.1 /100 | #249 | Tragic 8.2% |
| Nigerians | 1.1 /100 | #250 | Tragic 8.2% |
| Guyanese | 1.0 /100 | #251 | Tragic 8.2% |
| Ghanaians | 1.0 /100 | #252 | Tragic 8.2% |
| Immigrants | Guyana | 0.8 /100 | #253 | Tragic 8.2% |
| Immigrants | Caribbean | 0.7 /100 | #254 | Tragic 8.3% |
| Immigrants | Portugal | 0.6 /100 | #255 | Tragic 8.3% |
| Celtics | 0.6 /100 | #256 | Tragic 8.3% |
| British West Indians | 0.5 /100 | #257 | Tragic 8.3% |
| Immigrants | Ghana | 0.5 /100 | #258 | Tragic 8.3% |
| Barbadians | 0.4 /100 | #259 | Tragic 8.3% |
| Whites/Caucasians | 0.3 /100 | #260 | Tragic 8.4% |
| Immigrants | Liberia | 0.3 /100 | #261 | Tragic 8.4% |
| West Indians | 0.3 /100 | #262 | Tragic 8.4% |
| Scotch-Irish | 0.3 /100 | #263 | Tragic 8.4% |