Serbian vs Immigrants from Scotland Unemployment
COMPARE
Serbian
Immigrants from Scotland
Unemployment
Unemployment Comparison
Serbians
Immigrants from Scotland
4.9%
UNEMPLOYMENT
98.4/ 100
METRIC RATING
70th/ 347
METRIC RANK
4.9%
UNEMPLOYMENT
99.3/ 100
METRIC RATING
48th/ 347
METRIC RANK
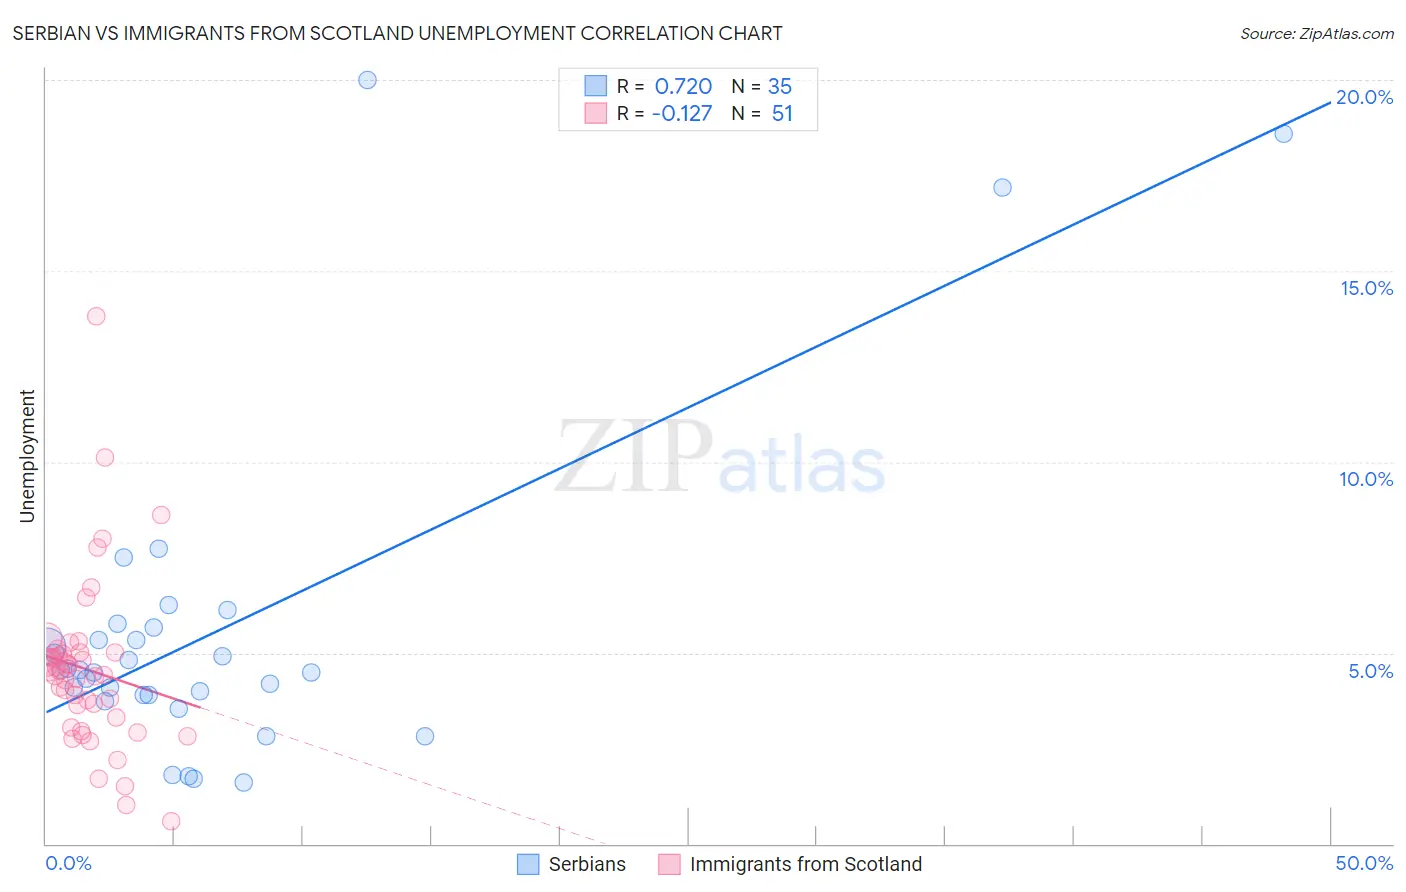
Serbian vs Immigrants from Scotland Unemployment Correlation Chart
The statistical analysis conducted on geographies consisting of 267,457,297 people shows a strong positive correlation between the proportion of Serbians and unemployment in the United States with a correlation coefficient (R) of 0.720 and weighted average of 4.9%. Similarly, the statistical analysis conducted on geographies consisting of 196,312,940 people shows a poor negative correlation between the proportion of Immigrants from Scotland and unemployment in the United States with a correlation coefficient (R) of -0.127 and weighted average of 4.9%, a difference of 1.4%.
Unemployment Correlation Summary
| Measurement | Serbian | Immigrants from Scotland |
| Minimum | 1.6% | 0.60% |
| Maximum | 20.0% | 13.8% |
| Range | 18.4% | 13.2% |
| Mean | 5.6% | 4.6% |
| Median | 4.6% | 4.5% |
| Interquartile 25% (IQ1) | 3.9% | 3.3% |
| Interquartile 75% (IQ3) | 5.7% | 5.0% |
| Interquartile Range (IQR) | 1.8% | 1.7% |
| Standard Deviation (Sample) | 4.3% | 2.2% |
| Standard Deviation (Population) | 4.2% | 2.2% |
Similar Demographics by Unemployment
Demographics Similar to Serbians by Unemployment
In terms of unemployment, the demographic groups most similar to Serbians are Immigrants from Japan (4.9%, a difference of 0.050%), Burmese (4.9%, a difference of 0.080%), Paraguayan (4.9%, a difference of 0.12%), Immigrants from North America (4.9%, a difference of 0.15%), and Immigrants from Northern Europe (4.9%, a difference of 0.21%).
| Demographics | Rating | Rank | Unemployment |
| Immigrants | Bulgaria | 98.9 /100 | #63 | Exceptional 4.9% |
| Italians | 98.9 /100 | #64 | Exceptional 4.9% |
| Immigrants | Canada | 98.8 /100 | #65 | Exceptional 4.9% |
| Slovaks | 98.7 /100 | #66 | Exceptional 4.9% |
| New Zealanders | 98.6 /100 | #67 | Exceptional 4.9% |
| Slavs | 98.6 /100 | #68 | Exceptional 4.9% |
| Immigrants | North America | 98.5 /100 | #69 | Exceptional 4.9% |
| Serbians | 98.4 /100 | #70 | Exceptional 4.9% |
| Immigrants | Japan | 98.3 /100 | #71 | Exceptional 4.9% |
| Burmese | 98.3 /100 | #72 | Exceptional 4.9% |
| Paraguayans | 98.3 /100 | #73 | Exceptional 4.9% |
| Immigrants | Northern Europe | 98.2 /100 | #74 | Exceptional 4.9% |
| Turks | 98.0 /100 | #75 | Exceptional 4.9% |
| German Russians | 98.0 /100 | #76 | Exceptional 4.9% |
| Cypriots | 97.9 /100 | #77 | Exceptional 4.9% |
Demographics Similar to Immigrants from Scotland by Unemployment
In terms of unemployment, the demographic groups most similar to Immigrants from Scotland are Immigrants from South Central Asia (4.9%, a difference of 0.010%), French Canadian (4.9%, a difference of 0.030%), Immigrants from Belgium (4.9%, a difference of 0.19%), White/Caucasian (4.9%, a difference of 0.20%), and Immigrants from Taiwan (4.8%, a difference of 0.22%).
| Demographics | Rating | Rank | Unemployment |
| Immigrants | Bosnia and Herzegovina | 99.7 /100 | #41 | Exceptional 4.8% |
| Filipinos | 99.5 /100 | #42 | Exceptional 4.8% |
| Yugoslavians | 99.5 /100 | #43 | Exceptional 4.8% |
| Austrians | 99.5 /100 | #44 | Exceptional 4.8% |
| French | 99.5 /100 | #45 | Exceptional 4.8% |
| Immigrants | Nepal | 99.4 /100 | #46 | Exceptional 4.8% |
| Immigrants | Taiwan | 99.4 /100 | #47 | Exceptional 4.8% |
| Immigrants | Scotland | 99.3 /100 | #48 | Exceptional 4.9% |
| Immigrants | South Central Asia | 99.3 /100 | #49 | Exceptional 4.9% |
| French Canadians | 99.3 /100 | #50 | Exceptional 4.9% |
| Immigrants | Belgium | 99.2 /100 | #51 | Exceptional 4.9% |
| Whites/Caucasians | 99.2 /100 | #52 | Exceptional 4.9% |
| Immigrants | Zimbabwe | 99.2 /100 | #53 | Exceptional 4.9% |
| Eastern Europeans | 99.2 /100 | #54 | Exceptional 4.9% |
| Australians | 99.2 /100 | #55 | Exceptional 4.9% |