Scottish vs Ecuadorian Female Unemployment
COMPARE
Scottish
Ecuadorian
Female Unemployment
Female Unemployment Comparison
Scottish
Ecuadorians
4.7%
FEMALE UNEMPLOYMENT
99.9/ 100
METRIC RATING
23rd/ 347
METRIC RANK
6.3%
FEMALE UNEMPLOYMENT
0.0/ 100
METRIC RATING
309th/ 347
METRIC RANK
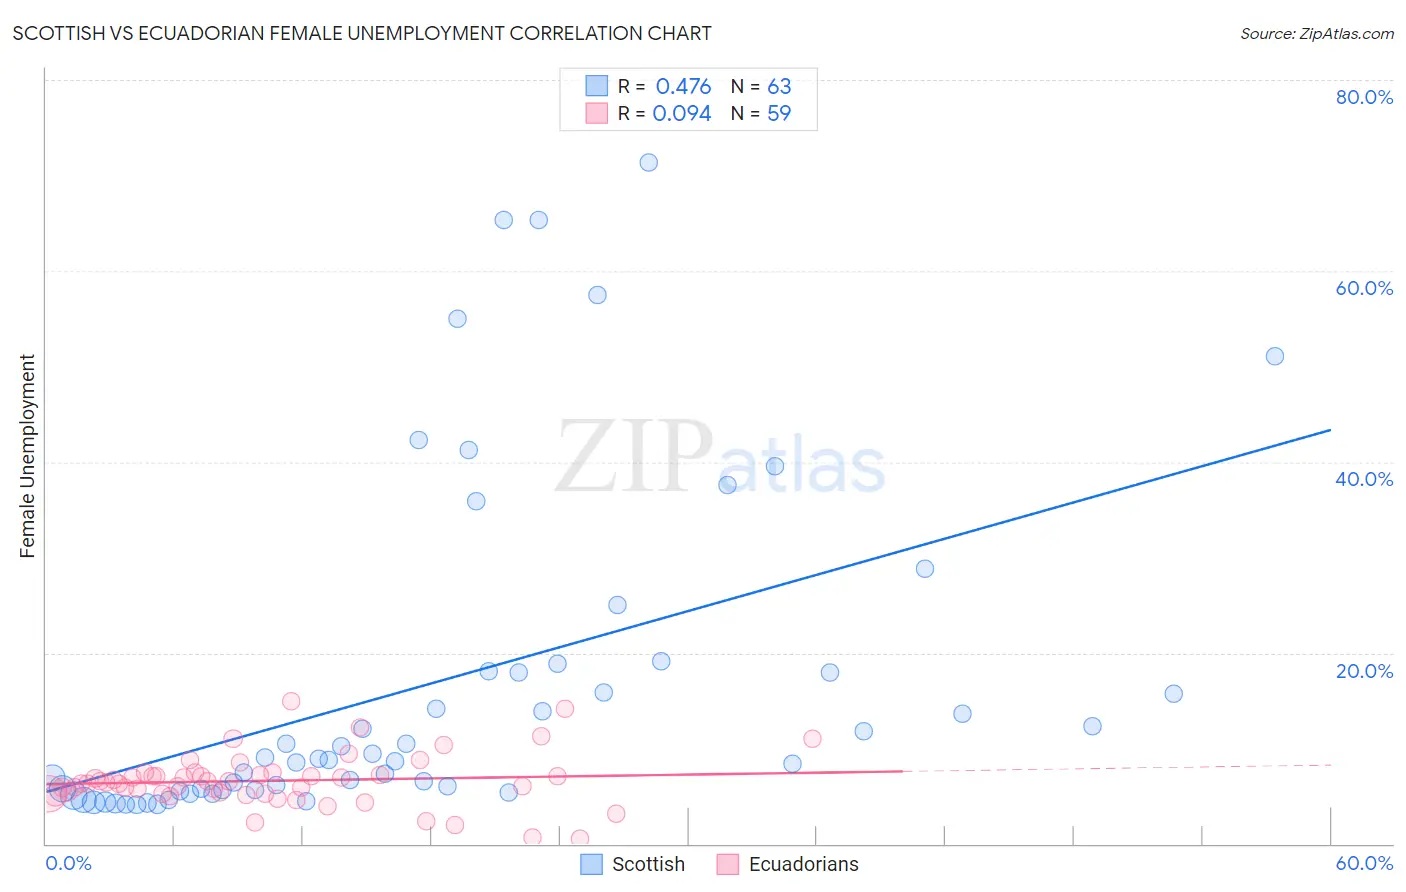
Scottish vs Ecuadorian Female Unemployment Correlation Chart
The statistical analysis conducted on geographies consisting of 553,178,597 people shows a moderate positive correlation between the proportion of Scottish and unemploymnet rate among females in the United States with a correlation coefficient (R) of 0.476 and weighted average of 4.7%. Similarly, the statistical analysis conducted on geographies consisting of 317,059,726 people shows a slight positive correlation between the proportion of Ecuadorians and unemploymnet rate among females in the United States with a correlation coefficient (R) of 0.094 and weighted average of 6.3%, a difference of 33.0%.
Female Unemployment Correlation Summary
| Measurement | Scottish | Ecuadorian |
| Minimum | 4.1% | 0.50% |
| Maximum | 71.4% | 14.9% |
| Range | 67.3% | 14.4% |
| Mean | 16.8% | 6.6% |
| Median | 8.9% | 6.4% |
| Interquartile 25% (IQ1) | 5.6% | 5.2% |
| Interquartile 75% (IQ3) | 18.0% | 7.2% |
| Interquartile Range (IQR) | 12.5% | 2.0% |
| Standard Deviation (Sample) | 17.5% | 2.8% |
| Standard Deviation (Population) | 17.4% | 2.7% |
Similar Demographics by Female Unemployment
Demographics Similar to Scottish by Female Unemployment
In terms of female unemployment, the demographic groups most similar to Scottish are Welsh (4.7%, a difference of 0.21%), Immigrants from India (4.7%, a difference of 0.29%), Immigrants from Bosnia and Herzegovina (4.7%, a difference of 0.33%), British (4.7%, a difference of 0.50%), and Irish (4.7%, a difference of 0.53%).
| Demographics | Rating | Rank | Female Unemployment |
| Carpatho Rusyns | 99.9 /100 | #16 | Exceptional 4.7% |
| Croatians | 99.9 /100 | #17 | Exceptional 4.7% |
| Latvians | 99.9 /100 | #18 | Exceptional 4.7% |
| Poles | 99.9 /100 | #19 | Exceptional 4.7% |
| Bulgarians | 99.9 /100 | #20 | Exceptional 4.7% |
| Fijians | 99.9 /100 | #21 | Exceptional 4.7% |
| Europeans | 99.9 /100 | #22 | Exceptional 4.7% |
| Scottish | 99.9 /100 | #23 | Exceptional 4.7% |
| Welsh | 99.9 /100 | #24 | Exceptional 4.7% |
| Immigrants | India | 99.9 /100 | #25 | Exceptional 4.7% |
| Immigrants | Bosnia and Herzegovina | 99.9 /100 | #26 | Exceptional 4.7% |
| British | 99.9 /100 | #27 | Exceptional 4.7% |
| Irish | 99.9 /100 | #28 | Exceptional 4.7% |
| Cypriots | 99.9 /100 | #29 | Exceptional 4.7% |
| Lithuanians | 99.8 /100 | #30 | Exceptional 4.7% |
Demographics Similar to Ecuadorians by Female Unemployment
In terms of female unemployment, the demographic groups most similar to Ecuadorians are Central American Indian (6.3%, a difference of 0.41%), Immigrants from Mexico (6.3%, a difference of 0.54%), Hispanic or Latino (6.2%, a difference of 0.58%), Shoshone (6.2%, a difference of 0.64%), and Immigrants from Central America (6.2%, a difference of 0.66%).
| Demographics | Rating | Rank | Female Unemployment |
| U.S. Virgin Islanders | 0.0 /100 | #302 | Tragic 6.2% |
| Barbadians | 0.0 /100 | #303 | Tragic 6.2% |
| Immigrants | Jamaica | 0.0 /100 | #304 | Tragic 6.2% |
| Spanish American Indians | 0.0 /100 | #305 | Tragic 6.2% |
| Immigrants | Central America | 0.0 /100 | #306 | Tragic 6.2% |
| Shoshone | 0.0 /100 | #307 | Tragic 6.2% |
| Hispanics or Latinos | 0.0 /100 | #308 | Tragic 6.2% |
| Ecuadorians | 0.0 /100 | #309 | Tragic 6.3% |
| Central American Indians | 0.0 /100 | #310 | Tragic 6.3% |
| Immigrants | Mexico | 0.0 /100 | #311 | Tragic 6.3% |
| Immigrants | Grenada | 0.0 /100 | #312 | Tragic 6.3% |
| Belizeans | 0.0 /100 | #313 | Tragic 6.3% |
| Immigrants | Ecuador | 0.0 /100 | #314 | Tragic 6.4% |
| Pueblo | 0.0 /100 | #315 | Tragic 6.4% |
| Houma | 0.0 /100 | #316 | Tragic 6.4% |