Scotch-Irish vs Shoshone Unemployment Among Seniors over 65 years
COMPARE
Scotch-Irish
Shoshone
Unemployment Among Seniors over 65 years
Unemployment Among Seniors over 65 years Comparison
Scotch-Irish
Shoshone
4.9%
UNEMPLOYMENT AMONG SENIORS OVER 65 YEARS
99.9/ 100
METRIC RATING
51st/ 347
METRIC RANK
5.9%
UNEMPLOYMENT AMONG SENIORS OVER 65 YEARS
0.0/ 100
METRIC RATING
326th/ 347
METRIC RANK
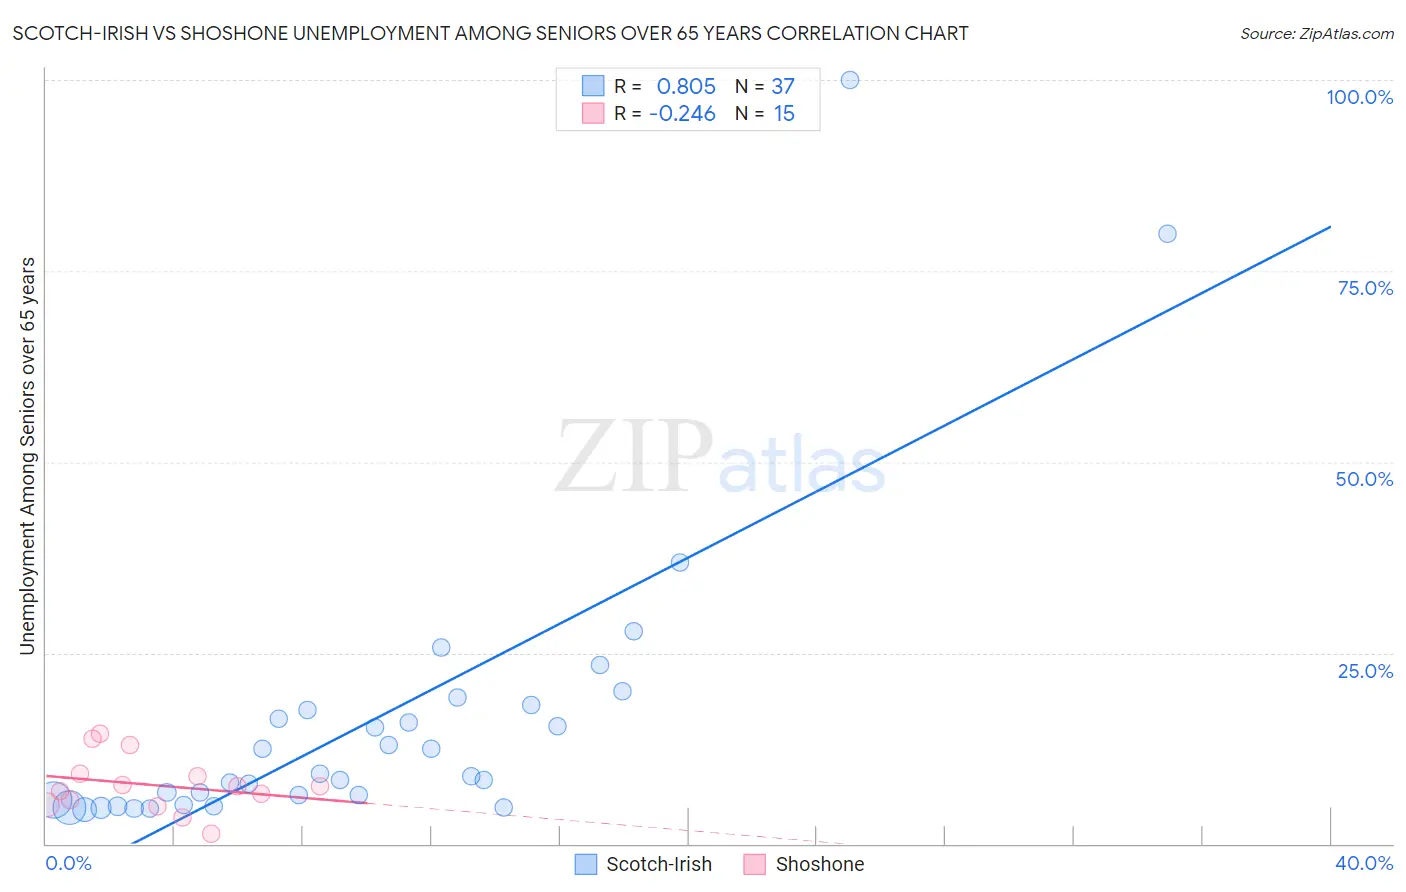
Scotch-Irish vs Shoshone Unemployment Among Seniors over 65 years Correlation Chart
The statistical analysis conducted on geographies consisting of 447,057,926 people shows a very strong positive correlation between the proportion of Scotch-Irish and unemployment rate amomg seniors over the age of 65 in the United States with a correlation coefficient (R) of 0.805 and weighted average of 4.9%. Similarly, the statistical analysis conducted on geographies consisting of 63,830,075 people shows a weak negative correlation between the proportion of Shoshone and unemployment rate amomg seniors over the age of 65 in the United States with a correlation coefficient (R) of -0.246 and weighted average of 5.9%, a difference of 20.1%.
Unemployment Among Seniors over 65 years Correlation Summary
| Measurement | Scotch-Irish | Shoshone |
| Minimum | 4.4% | 1.3% |
| Maximum | 100.0% | 14.4% |
| Range | 95.6% | 13.1% |
| Mean | 16.1% | 7.7% |
| Median | 8.9% | 7.6% |
| Interquartile 25% (IQ1) | 5.4% | 5.0% |
| Interquartile 75% (IQ3) | 17.8% | 9.1% |
| Interquartile Range (IQR) | 12.3% | 4.1% |
| Standard Deviation (Sample) | 19.6% | 3.7% |
| Standard Deviation (Population) | 19.4% | 3.6% |
Similar Demographics by Unemployment Among Seniors over 65 years
Demographics Similar to Scotch-Irish by Unemployment Among Seniors over 65 years
In terms of unemployment among seniors over 65 years, the demographic groups most similar to Scotch-Irish are Swedish (4.9%, a difference of 0.020%), Immigrants from Sudan (4.9%, a difference of 0.060%), Immigrants from Austria (4.9%, a difference of 0.12%), Immigrants from Iraq (4.9%, a difference of 0.12%), and Immigrants from Kenya (4.9%, a difference of 0.13%).
| Demographics | Rating | Rank | Unemployment Among Seniors over 65 years |
| Jordanians | 99.9 /100 | #44 | Exceptional 4.9% |
| Ethiopians | 99.9 /100 | #45 | Exceptional 4.9% |
| Immigrants | Jordan | 99.9 /100 | #46 | Exceptional 4.9% |
| Germans | 99.9 /100 | #47 | Exceptional 4.9% |
| Choctaw | 99.9 /100 | #48 | Exceptional 4.9% |
| Immigrants | Kenya | 99.9 /100 | #49 | Exceptional 4.9% |
| Immigrants | Austria | 99.9 /100 | #50 | Exceptional 4.9% |
| Scotch-Irish | 99.9 /100 | #51 | Exceptional 4.9% |
| Swedes | 99.9 /100 | #52 | Exceptional 4.9% |
| Immigrants | Sudan | 99.8 /100 | #53 | Exceptional 4.9% |
| Immigrants | Iraq | 99.8 /100 | #54 | Exceptional 4.9% |
| Europeans | 99.8 /100 | #55 | Exceptional 4.9% |
| Carpatho Rusyns | 99.8 /100 | #56 | Exceptional 4.9% |
| Danes | 99.8 /100 | #57 | Exceptional 4.9% |
| Scandinavians | 99.8 /100 | #58 | Exceptional 4.9% |
Demographics Similar to Shoshone by Unemployment Among Seniors over 65 years
In terms of unemployment among seniors over 65 years, the demographic groups most similar to Shoshone are Inupiat (5.8%, a difference of 0.43%), Bermudan (5.9%, a difference of 0.48%), Yuman (5.8%, a difference of 1.0%), Puerto Rican (5.9%, a difference of 1.0%), and Immigrants from Dominica (5.8%, a difference of 1.2%).
| Demographics | Rating | Rank | Unemployment Among Seniors over 65 years |
| Immigrants | Bangladesh | 0.0 /100 | #319 | Tragic 5.7% |
| Immigrants | Mexico | 0.0 /100 | #320 | Tragic 5.7% |
| British West Indians | 0.0 /100 | #321 | Tragic 5.8% |
| Natives/Alaskans | 0.0 /100 | #322 | Tragic 5.8% |
| Immigrants | Dominica | 0.0 /100 | #323 | Tragic 5.8% |
| Yuman | 0.0 /100 | #324 | Tragic 5.8% |
| Inupiat | 0.0 /100 | #325 | Tragic 5.8% |
| Shoshone | 0.0 /100 | #326 | Tragic 5.9% |
| Bermudans | 0.0 /100 | #327 | Tragic 5.9% |
| Puerto Ricans | 0.0 /100 | #328 | Tragic 5.9% |
| Dominicans | 0.0 /100 | #329 | Tragic 6.0% |
| Immigrants | Portugal | 0.0 /100 | #330 | Tragic 6.0% |
| Taiwanese | 0.0 /100 | #331 | Tragic 6.0% |
| Aleuts | 0.0 /100 | #332 | Tragic 6.0% |
| Immigrants | Dominican Republic | 0.0 /100 | #333 | Tragic 6.0% |