Mongolian vs Choctaw Unemployment
COMPARE
Mongolian
Choctaw
Unemployment
Unemployment Comparison
Mongolians
Choctaw
5.0%
UNEMPLOYMENT
94.8/ 100
METRIC RATING
99th/ 347
METRIC RANK
5.4%
UNEMPLOYMENT
12.7/ 100
METRIC RATING
218th/ 347
METRIC RANK
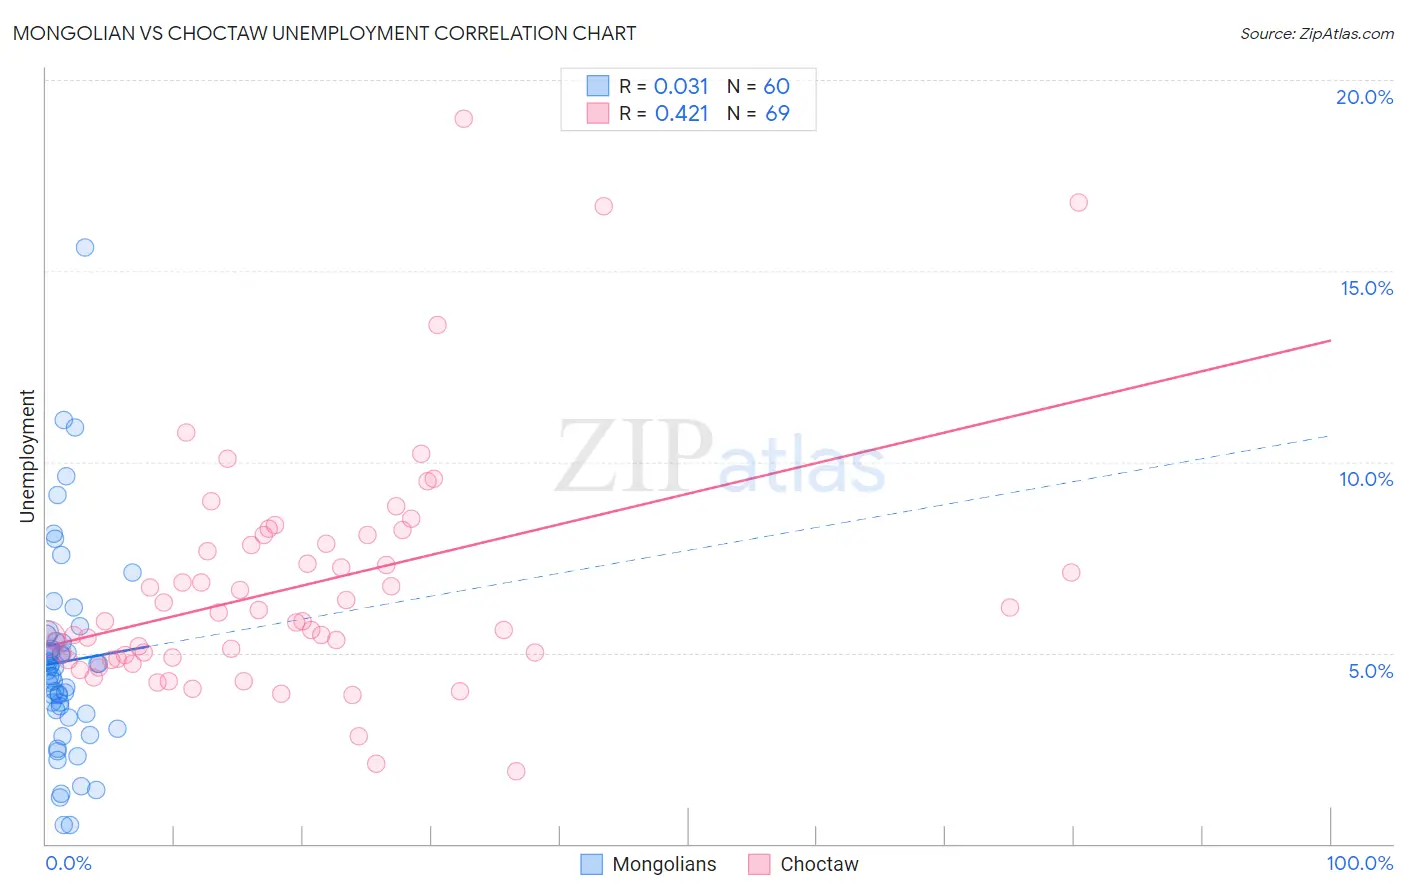
Mongolian vs Choctaw Unemployment Correlation Chart
The statistical analysis conducted on geographies consisting of 140,354,726 people shows no correlation between the proportion of Mongolians and unemployment in the United States with a correlation coefficient (R) of 0.031 and weighted average of 5.0%. Similarly, the statistical analysis conducted on geographies consisting of 269,338,927 people shows a moderate positive correlation between the proportion of Choctaw and unemployment in the United States with a correlation coefficient (R) of 0.421 and weighted average of 5.4%, a difference of 7.7%.
Unemployment Correlation Summary
| Measurement | Mongolian | Choctaw |
| Minimum | 0.50% | 1.9% |
| Maximum | 15.6% | 19.0% |
| Range | 15.1% | 17.1% |
| Mean | 4.8% | 6.7% |
| Median | 4.6% | 5.8% |
| Interquartile 25% (IQ1) | 3.5% | 4.9% |
| Interquartile 75% (IQ3) | 5.3% | 8.0% |
| Interquartile Range (IQR) | 1.8% | 3.1% |
| Standard Deviation (Sample) | 2.6% | 3.1% |
| Standard Deviation (Population) | 2.6% | 3.1% |
Similar Demographics by Unemployment
Demographics Similar to Mongolians by Unemployment
In terms of unemployment, the demographic groups most similar to Mongolians are Estonian (5.0%, a difference of 0.060%), Romanian (5.0%, a difference of 0.070%), Immigrants from Czechoslovakia (5.0%, a difference of 0.10%), Immigrants from England (5.0%, a difference of 0.13%), and American (5.0%, a difference of 0.15%).
| Demographics | Rating | Rank | Unemployment |
| Immigrants | South Africa | 96.2 /100 | #92 | Exceptional 5.0% |
| Ukrainians | 96.0 /100 | #93 | Exceptional 5.0% |
| Immigrants | Austria | 95.9 /100 | #94 | Exceptional 5.0% |
| Immigrants | Serbia | 95.6 /100 | #95 | Exceptional 5.0% |
| Immigrants | England | 95.2 /100 | #96 | Exceptional 5.0% |
| Immigrants | Czechoslovakia | 95.1 /100 | #97 | Exceptional 5.0% |
| Romanians | 95.0 /100 | #98 | Exceptional 5.0% |
| Mongolians | 94.8 /100 | #99 | Exceptional 5.0% |
| Estonians | 94.6 /100 | #100 | Exceptional 5.0% |
| Americans | 94.3 /100 | #101 | Exceptional 5.0% |
| Immigrants | Argentina | 94.1 /100 | #102 | Exceptional 5.0% |
| Chickasaw | 94.0 /100 | #103 | Exceptional 5.0% |
| Osage | 94.0 /100 | #104 | Exceptional 5.0% |
| Maltese | 94.0 /100 | #105 | Exceptional 5.0% |
| Immigrants | Romania | 93.7 /100 | #106 | Exceptional 5.0% |
Demographics Similar to Choctaw by Unemployment
In terms of unemployment, the demographic groups most similar to Choctaw are Immigrants from South America (5.4%, a difference of 0.10%), Immigrants from Albania (5.4%, a difference of 0.10%), Bangladeshi (5.4%, a difference of 0.22%), Delaware (5.4%, a difference of 0.26%), and Soviet Union (5.4%, a difference of 0.30%).
| Demographics | Rating | Rank | Unemployment |
| Iraqis | 18.1 /100 | #211 | Poor 5.4% |
| Ugandans | 18.0 /100 | #212 | Poor 5.4% |
| Immigrants | Middle Africa | 15.3 /100 | #213 | Poor 5.4% |
| Immigrants | Costa Rica | 15.2 /100 | #214 | Poor 5.4% |
| Delaware | 14.7 /100 | #215 | Poor 5.4% |
| Immigrants | South America | 13.5 /100 | #216 | Poor 5.4% |
| Immigrants | Albania | 13.5 /100 | #217 | Poor 5.4% |
| Choctaw | 12.7 /100 | #218 | Poor 5.4% |
| Bangladeshis | 11.2 /100 | #219 | Poor 5.4% |
| Soviet Union | 10.6 /100 | #220 | Poor 5.4% |
| Immigrants | Philippines | 10.4 /100 | #221 | Poor 5.4% |
| Iroquois | 10.3 /100 | #222 | Poor 5.4% |
| Seminole | 9.2 /100 | #223 | Tragic 5.4% |
| Israelis | 8.8 /100 | #224 | Tragic 5.4% |
| South American Indians | 7.8 /100 | #225 | Tragic 5.5% |