French vs Choctaw Unemployment
COMPARE
French
Choctaw
Unemployment
Unemployment Comparison
French
Choctaw
4.8%
UNEMPLOYMENT
99.5/ 100
METRIC RATING
45th/ 347
METRIC RANK
5.4%
UNEMPLOYMENT
12.7/ 100
METRIC RATING
218th/ 347
METRIC RANK
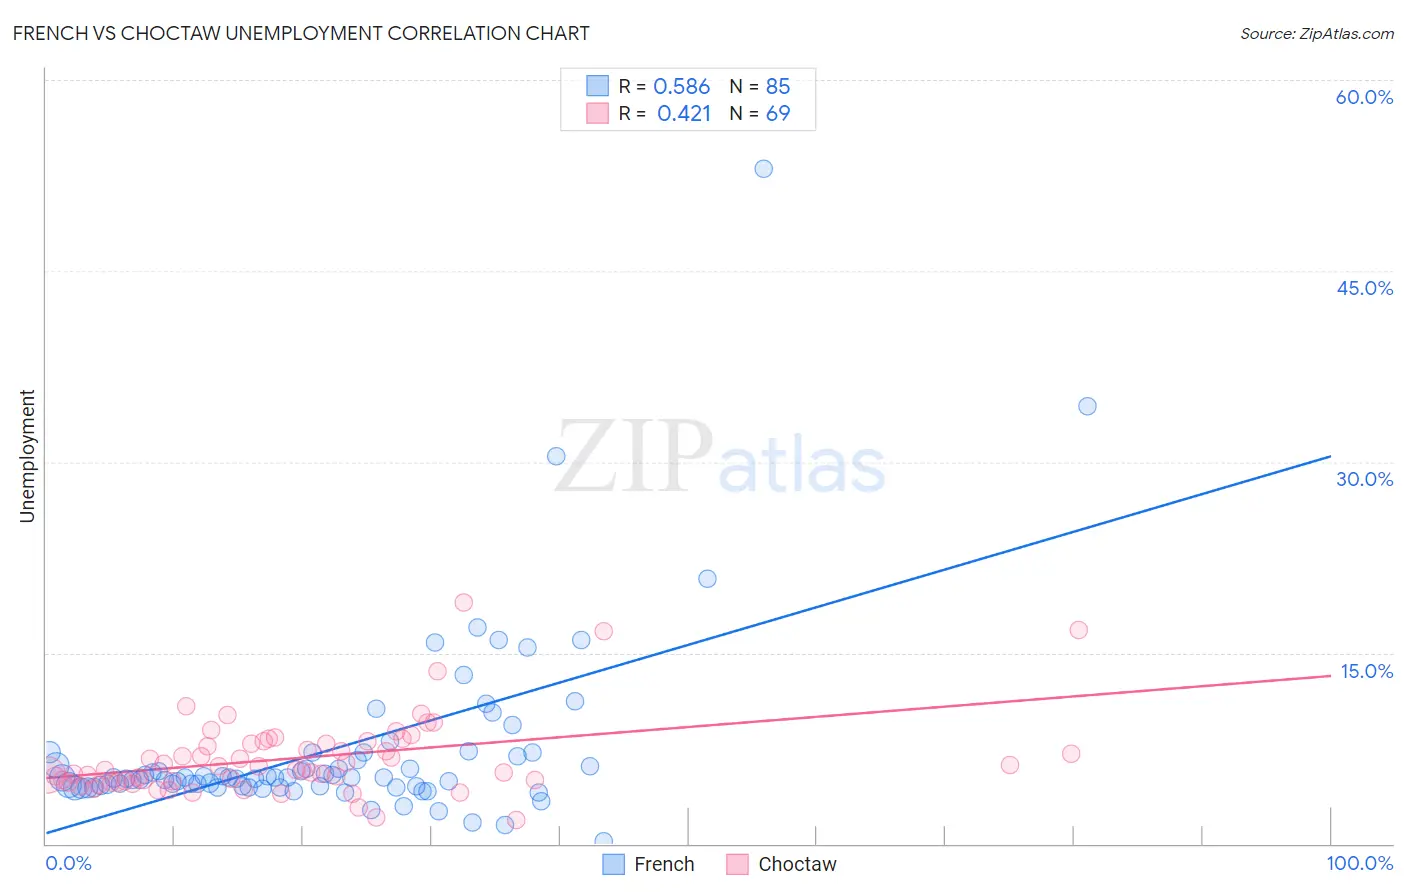
French vs Choctaw Unemployment Correlation Chart
The statistical analysis conducted on geographies consisting of 568,292,844 people shows a substantial positive correlation between the proportion of French and unemployment in the United States with a correlation coefficient (R) of 0.586 and weighted average of 4.8%. Similarly, the statistical analysis conducted on geographies consisting of 269,338,927 people shows a moderate positive correlation between the proportion of Choctaw and unemployment in the United States with a correlation coefficient (R) of 0.421 and weighted average of 5.4%, a difference of 11.9%.
Unemployment Correlation Summary
| Measurement | French | Choctaw |
| Minimum | 0.20% | 1.9% |
| Maximum | 53.0% | 19.0% |
| Range | 52.8% | 17.1% |
| Mean | 7.4% | 6.7% |
| Median | 5.2% | 5.8% |
| Interquartile 25% (IQ1) | 4.5% | 4.9% |
| Interquartile 75% (IQ3) | 7.0% | 8.0% |
| Interquartile Range (IQR) | 2.5% | 3.1% |
| Standard Deviation (Sample) | 7.3% | 3.1% |
| Standard Deviation (Population) | 7.3% | 3.1% |
Similar Demographics by Unemployment
Demographics Similar to French by Unemployment
In terms of unemployment, the demographic groups most similar to French are Austrian (4.8%, a difference of 0.050%), Yugoslavian (4.8%, a difference of 0.11%), Immigrants from Nepal (4.8%, a difference of 0.16%), Immigrants from Taiwan (4.8%, a difference of 0.18%), and Filipino (4.8%, a difference of 0.31%).
| Demographics | Rating | Rank | Unemployment |
| Bolivians | 99.7 /100 | #38 | Exceptional 4.8% |
| Lithuanians | 99.7 /100 | #39 | Exceptional 4.8% |
| Northern Europeans | 99.7 /100 | #40 | Exceptional 4.8% |
| Immigrants | Bosnia and Herzegovina | 99.7 /100 | #41 | Exceptional 4.8% |
| Filipinos | 99.5 /100 | #42 | Exceptional 4.8% |
| Yugoslavians | 99.5 /100 | #43 | Exceptional 4.8% |
| Austrians | 99.5 /100 | #44 | Exceptional 4.8% |
| French | 99.5 /100 | #45 | Exceptional 4.8% |
| Immigrants | Nepal | 99.4 /100 | #46 | Exceptional 4.8% |
| Immigrants | Taiwan | 99.4 /100 | #47 | Exceptional 4.8% |
| Immigrants | Scotland | 99.3 /100 | #48 | Exceptional 4.9% |
| Immigrants | South Central Asia | 99.3 /100 | #49 | Exceptional 4.9% |
| French Canadians | 99.3 /100 | #50 | Exceptional 4.9% |
| Immigrants | Belgium | 99.2 /100 | #51 | Exceptional 4.9% |
| Whites/Caucasians | 99.2 /100 | #52 | Exceptional 4.9% |
Demographics Similar to Choctaw by Unemployment
In terms of unemployment, the demographic groups most similar to Choctaw are Immigrants from South America (5.4%, a difference of 0.10%), Immigrants from Albania (5.4%, a difference of 0.10%), Bangladeshi (5.4%, a difference of 0.22%), Delaware (5.4%, a difference of 0.26%), and Soviet Union (5.4%, a difference of 0.30%).
| Demographics | Rating | Rank | Unemployment |
| Iraqis | 18.1 /100 | #211 | Poor 5.4% |
| Ugandans | 18.0 /100 | #212 | Poor 5.4% |
| Immigrants | Middle Africa | 15.3 /100 | #213 | Poor 5.4% |
| Immigrants | Costa Rica | 15.2 /100 | #214 | Poor 5.4% |
| Delaware | 14.7 /100 | #215 | Poor 5.4% |
| Immigrants | South America | 13.5 /100 | #216 | Poor 5.4% |
| Immigrants | Albania | 13.5 /100 | #217 | Poor 5.4% |
| Choctaw | 12.7 /100 | #218 | Poor 5.4% |
| Bangladeshis | 11.2 /100 | #219 | Poor 5.4% |
| Soviet Union | 10.6 /100 | #220 | Poor 5.4% |
| Immigrants | Philippines | 10.4 /100 | #221 | Poor 5.4% |
| Iroquois | 10.3 /100 | #222 | Poor 5.4% |
| Seminole | 9.2 /100 | #223 | Tragic 5.4% |
| Israelis | 8.8 /100 | #224 | Tragic 5.4% |
| South American Indians | 7.8 /100 | #225 | Tragic 5.5% |