Immigrants from Panama vs Immigrants from Kuwait Male Unemployment
COMPARE
Immigrants from Panama
Immigrants from Kuwait
Male Unemployment
Male Unemployment Comparison
Immigrants from Panama
Immigrants from Kuwait
5.6%
MALE UNEMPLOYMENT
1.8/ 100
METRIC RATING
227th/ 347
METRIC RANK
5.1%
MALE UNEMPLOYMENT
93.3/ 100
METRIC RATING
98th/ 347
METRIC RANK
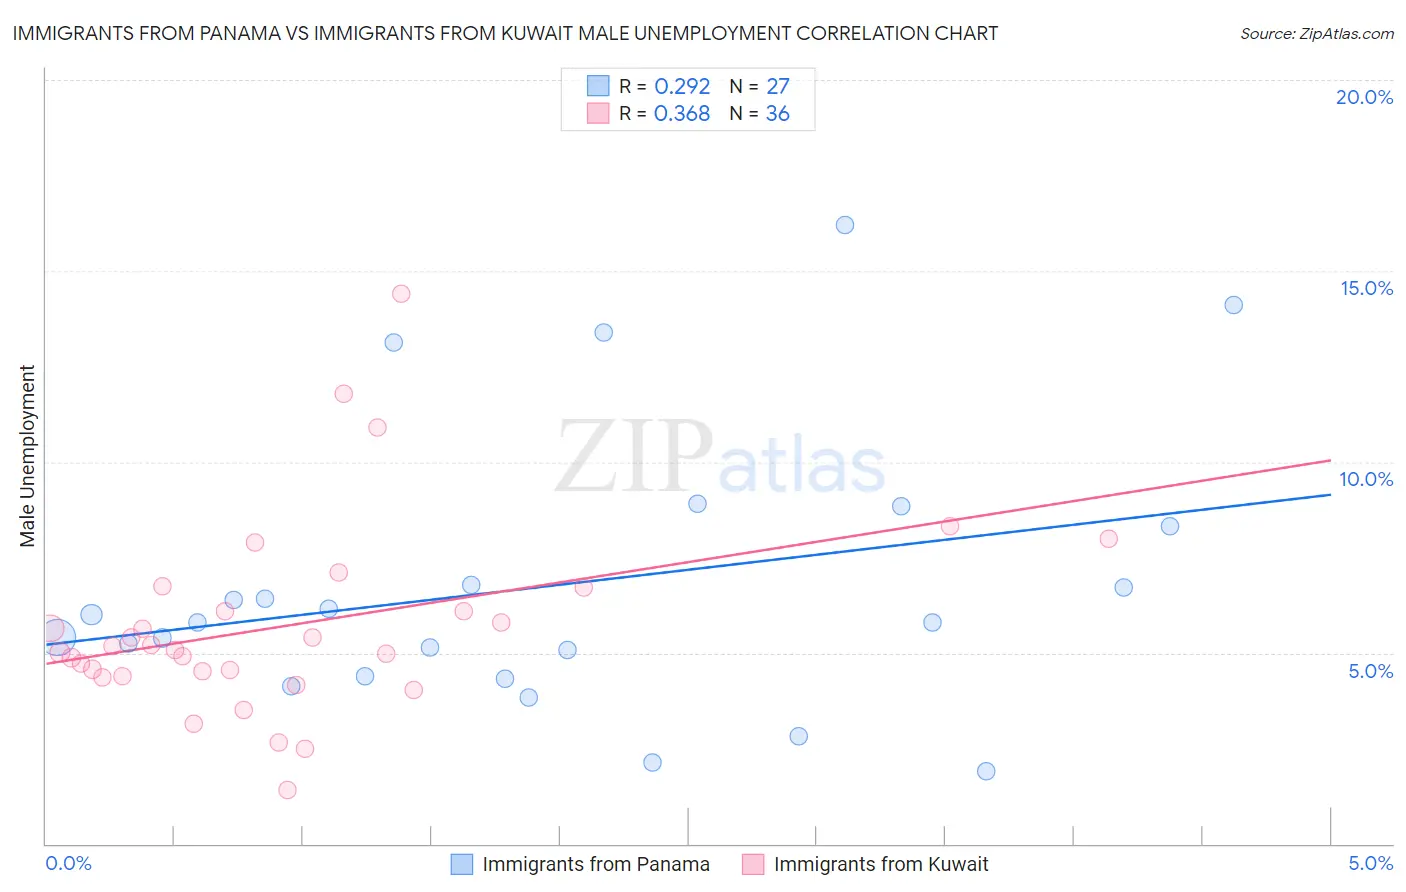
Immigrants from Panama vs Immigrants from Kuwait Male Unemployment Correlation Chart
The statistical analysis conducted on geographies consisting of 220,860,103 people shows a weak positive correlation between the proportion of Immigrants from Panama and unemployment rate among males in the United States with a correlation coefficient (R) of 0.292 and weighted average of 5.6%. Similarly, the statistical analysis conducted on geographies consisting of 136,850,948 people shows a mild positive correlation between the proportion of Immigrants from Kuwait and unemployment rate among males in the United States with a correlation coefficient (R) of 0.368 and weighted average of 5.1%, a difference of 10.1%.
Male Unemployment Correlation Summary
| Measurement | Immigrants from Panama | Immigrants from Kuwait |
| Minimum | 1.9% | 1.4% |
| Maximum | 16.2% | 14.4% |
| Range | 14.3% | 13.0% |
| Mean | 6.8% | 5.7% |
| Median | 5.8% | 5.1% |
| Interquartile 25% (IQ1) | 4.4% | 4.5% |
| Interquartile 75% (IQ3) | 8.3% | 6.4% |
| Interquartile Range (IQR) | 3.9% | 1.9% |
| Standard Deviation (Sample) | 3.6% | 2.5% |
| Standard Deviation (Population) | 3.6% | 2.5% |
Similar Demographics by Male Unemployment
Demographics Similar to Immigrants from Panama by Male Unemployment
In terms of male unemployment, the demographic groups most similar to Immigrants from Panama are Immigrants from Cambodia (5.6%, a difference of 0.0%), Seminole (5.6%, a difference of 0.020%), Central American (5.6%, a difference of 0.020%), Immigrants from Africa (5.6%, a difference of 0.060%), and Panamanian (5.6%, a difference of 0.090%).
| Demographics | Rating | Rank | Male Unemployment |
| Portuguese | 3.5 /100 | #220 | Tragic 5.6% |
| Soviet Union | 3.2 /100 | #221 | Tragic 5.6% |
| Immigrants | Micronesia | 2.9 /100 | #222 | Tragic 5.6% |
| Creek | 2.6 /100 | #223 | Tragic 5.6% |
| Cherokee | 2.4 /100 | #224 | Tragic 5.6% |
| Panamanians | 1.9 /100 | #225 | Tragic 5.6% |
| Immigrants | Cambodia | 1.8 /100 | #226 | Tragic 5.6% |
| Immigrants | Panama | 1.8 /100 | #227 | Tragic 5.6% |
| Seminole | 1.8 /100 | #228 | Tragic 5.6% |
| Central Americans | 1.8 /100 | #229 | Tragic 5.6% |
| Immigrants | Africa | 1.7 /100 | #230 | Tragic 5.6% |
| Choctaw | 1.6 /100 | #231 | Tragic 5.6% |
| Moroccans | 1.6 /100 | #232 | Tragic 5.6% |
| Somalis | 1.5 /100 | #233 | Tragic 5.6% |
| Immigrants | Somalia | 1.5 /100 | #234 | Tragic 5.6% |
Demographics Similar to Immigrants from Kuwait by Male Unemployment
In terms of male unemployment, the demographic groups most similar to Immigrants from Kuwait are Immigrants from Spain (5.1%, a difference of 0.040%), Uruguayan (5.1%, a difference of 0.070%), Russian (5.1%, a difference of 0.080%), Asian (5.1%, a difference of 0.11%), and German Russian (5.1%, a difference of 0.12%).
| Demographics | Rating | Rank | Male Unemployment |
| Immigrants | Turkey | 94.4 /100 | #91 | Exceptional 5.1% |
| Slavs | 94.2 /100 | #92 | Exceptional 5.1% |
| Immigrants | Serbia | 94.2 /100 | #93 | Exceptional 5.1% |
| Canadians | 94.1 /100 | #94 | Exceptional 5.1% |
| Italians | 93.8 /100 | #95 | Exceptional 5.1% |
| Asians | 93.7 /100 | #96 | Exceptional 5.1% |
| Immigrants | Spain | 93.4 /100 | #97 | Exceptional 5.1% |
| Immigrants | Kuwait | 93.3 /100 | #98 | Exceptional 5.1% |
| Uruguayans | 93.0 /100 | #99 | Exceptional 5.1% |
| Russians | 92.9 /100 | #100 | Exceptional 5.1% |
| German Russians | 92.7 /100 | #101 | Exceptional 5.1% |
| Immigrants | France | 92.7 /100 | #102 | Exceptional 5.1% |
| Immigrants | Jordan | 91.9 /100 | #103 | Exceptional 5.1% |
| Immigrants | Chile | 91.8 /100 | #104 | Exceptional 5.1% |
| Immigrants | Czechoslovakia | 91.7 /100 | #105 | Exceptional 5.1% |