Scandinavian vs Immigrants from Guyana Disability Age Over 75
COMPARE
Scandinavian
Immigrants from Guyana
Disability Age Over 75
Disability Age Over 75 Comparison
Scandinavians
Immigrants from Guyana
46.6%
DISABILITY AGE OVER 75
93.6/ 100
METRIC RATING
121st/ 347
METRIC RANK
47.1%
DISABILITY AGE OVER 75
71.9/ 100
METRIC RATING
158th/ 347
METRIC RANK
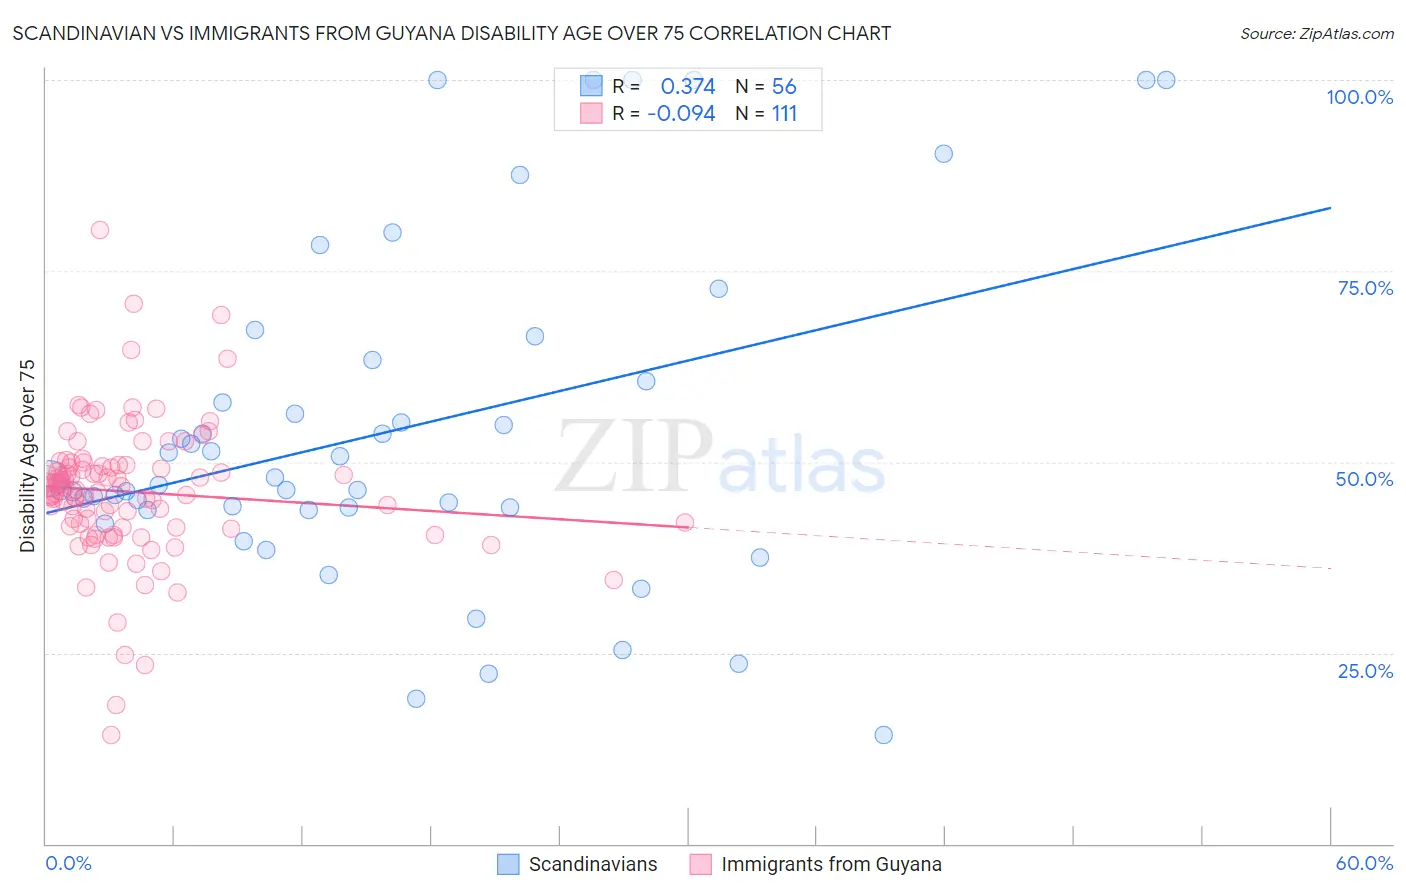
Scandinavian vs Immigrants from Guyana Disability Age Over 75 Correlation Chart
The statistical analysis conducted on geographies consisting of 471,447,012 people shows a mild positive correlation between the proportion of Scandinavians and percentage of population with a disability over the age of 75 in the United States with a correlation coefficient (R) of 0.374 and weighted average of 46.6%. Similarly, the statistical analysis conducted on geographies consisting of 183,514,554 people shows a slight negative correlation between the proportion of Immigrants from Guyana and percentage of population with a disability over the age of 75 in the United States with a correlation coefficient (R) of -0.094 and weighted average of 47.1%, a difference of 1.0%.
Disability Age Over 75 Correlation Summary
| Measurement | Scandinavian | Immigrants from Guyana |
| Minimum | 14.3% | 14.3% |
| Maximum | 100.0% | 80.4% |
| Range | 85.7% | 66.1% |
| Mean | 54.2% | 46.1% |
| Median | 47.4% | 46.7% |
| Interquartile 25% (IQ1) | 43.9% | 41.4% |
| Interquartile 75% (IQ3) | 62.0% | 49.5% |
| Interquartile Range (IQR) | 18.1% | 8.1% |
| Standard Deviation (Sample) | 21.9% | 9.1% |
| Standard Deviation (Population) | 21.7% | 9.1% |
Similar Demographics by Disability Age Over 75
Demographics Similar to Scandinavians by Disability Age Over 75
In terms of disability age over 75, the demographic groups most similar to Scandinavians are Immigrants from Nepal (46.6%, a difference of 0.050%), Immigrants from Albania (46.6%, a difference of 0.050%), Canadian (46.6%, a difference of 0.080%), Czechoslovakian (46.6%, a difference of 0.10%), and Immigrants from Colombia (46.7%, a difference of 0.10%).
| Demographics | Rating | Rank | Disability Age Over 75 |
| Dutch | 95.9 /100 | #114 | Exceptional 46.5% |
| British | 95.7 /100 | #115 | Exceptional 46.5% |
| Indians (Asian) | 95.7 /100 | #116 | Exceptional 46.5% |
| Hungarians | 95.3 /100 | #117 | Exceptional 46.5% |
| Czechoslovakians | 94.7 /100 | #118 | Exceptional 46.6% |
| Canadians | 94.4 /100 | #119 | Exceptional 46.6% |
| Immigrants | Nepal | 94.1 /100 | #120 | Exceptional 46.6% |
| Scandinavians | 93.6 /100 | #121 | Exceptional 46.6% |
| Immigrants | Albania | 93.2 /100 | #122 | Exceptional 46.6% |
| Immigrants | Colombia | 92.6 /100 | #123 | Exceptional 46.7% |
| Immigrants | South America | 91.8 /100 | #124 | Exceptional 46.7% |
| Colombians | 91.3 /100 | #125 | Exceptional 46.7% |
| Europeans | 91.2 /100 | #126 | Exceptional 46.7% |
| Syrians | 91.1 /100 | #127 | Exceptional 46.7% |
| Icelanders | 90.9 /100 | #128 | Exceptional 46.7% |
Demographics Similar to Immigrants from Guyana by Disability Age Over 75
In terms of disability age over 75, the demographic groups most similar to Immigrants from Guyana are Immigrants from Morocco (47.1%, a difference of 0.010%), Bhutanese (47.1%, a difference of 0.020%), Arab (47.1%, a difference of 0.040%), Immigrants from Zaire (47.1%, a difference of 0.080%), and Immigrants from Belarus (47.1%, a difference of 0.080%).
| Demographics | Rating | Rank | Disability Age Over 75 |
| French Canadians | 79.0 /100 | #151 | Good 47.0% |
| Immigrants | Asia | 76.5 /100 | #152 | Good 47.0% |
| Immigrants | Zaire | 74.8 /100 | #153 | Good 47.1% |
| Immigrants | Belarus | 74.8 /100 | #154 | Good 47.1% |
| Immigrants | Iran | 74.7 /100 | #155 | Good 47.1% |
| Arabs | 73.3 /100 | #156 | Good 47.1% |
| Bhutanese | 72.6 /100 | #157 | Good 47.1% |
| Immigrants | Guyana | 71.9 /100 | #158 | Good 47.1% |
| Immigrants | Morocco | 71.4 /100 | #159 | Good 47.1% |
| Immigrants | Middle Africa | 68.3 /100 | #160 | Good 47.1% |
| South American Indians | 68.1 /100 | #161 | Good 47.1% |
| Pennsylvania Germans | 66.0 /100 | #162 | Good 47.2% |
| Immigrants | Eastern Africa | 65.5 /100 | #163 | Good 47.2% |
| French | 64.6 /100 | #164 | Good 47.2% |
| Immigrants | Zimbabwe | 64.4 /100 | #165 | Good 47.2% |