Immigrants from Iran vs Alsatian Unemployment
COMPARE
Immigrants from Iran
Alsatian
Unemployment
Unemployment Comparison
Immigrants from Iran
Alsatians
5.4%
UNEMPLOYMENT
18.8/ 100
METRIC RATING
209th/ 347
METRIC RANK
5.3%
UNEMPLOYMENT
37.0/ 100
METRIC RATING
188th/ 347
METRIC RANK
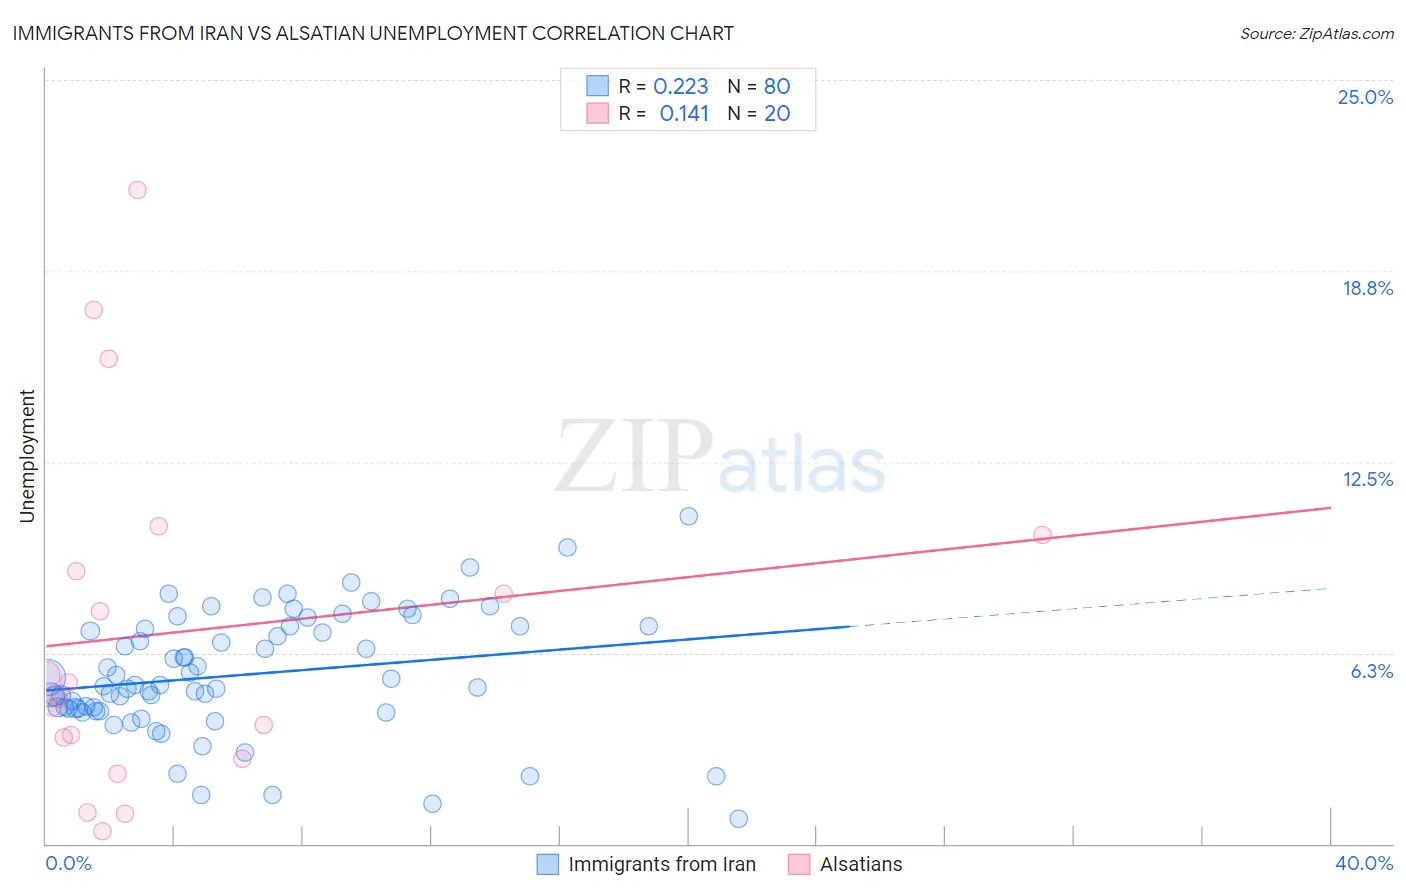
Immigrants from Iran vs Alsatian Unemployment Correlation Chart
The statistical analysis conducted on geographies consisting of 279,810,569 people shows a weak positive correlation between the proportion of Immigrants from Iran and unemployment in the United States with a correlation coefficient (R) of 0.223 and weighted average of 5.4%. Similarly, the statistical analysis conducted on geographies consisting of 82,657,373 people shows a poor positive correlation between the proportion of Alsatians and unemployment in the United States with a correlation coefficient (R) of 0.141 and weighted average of 5.3%, a difference of 1.4%.
Unemployment Correlation Summary
| Measurement | Immigrants from Iran | Alsatian |
| Minimum | 0.80% | 0.40% |
| Maximum | 10.7% | 21.4% |
| Range | 9.9% | 21.0% |
| Mean | 5.5% | 6.9% |
| Median | 5.2% | 5.0% |
| Interquartile 25% (IQ1) | 4.4% | 3.1% |
| Interquartile 75% (IQ3) | 7.1% | 9.5% |
| Interquartile Range (IQR) | 2.6% | 6.4% |
| Standard Deviation (Sample) | 2.0% | 5.7% |
| Standard Deviation (Population) | 2.0% | 5.6% |
Similar Demographics by Unemployment
Demographics Similar to Immigrants from Iran by Unemployment
In terms of unemployment, the demographic groups most similar to Immigrants from Iran are Immigrants from Iraq (5.4%, a difference of 0.020%), Portuguese (5.4%, a difference of 0.030%), Creek (5.4%, a difference of 0.060%), Iraqi (5.4%, a difference of 0.070%), and Ugandan (5.4%, a difference of 0.080%).
| Demographics | Rating | Rank | Unemployment |
| Cherokee | 25.5 /100 | #202 | Fair 5.3% |
| Immigrants | Micronesia | 25.2 /100 | #203 | Fair 5.3% |
| Immigrants | Ukraine | 24.9 /100 | #204 | Fair 5.3% |
| Native Hawaiians | 24.1 /100 | #205 | Fair 5.3% |
| Immigrants | Peru | 22.7 /100 | #206 | Fair 5.4% |
| Creek | 19.4 /100 | #207 | Poor 5.4% |
| Portuguese | 19.0 /100 | #208 | Poor 5.4% |
| Immigrants | Iran | 18.8 /100 | #209 | Poor 5.4% |
| Immigrants | Iraq | 18.6 /100 | #210 | Poor 5.4% |
| Iraqis | 18.1 /100 | #211 | Poor 5.4% |
| Ugandans | 18.0 /100 | #212 | Poor 5.4% |
| Immigrants | Middle Africa | 15.3 /100 | #213 | Poor 5.4% |
| Immigrants | Costa Rica | 15.2 /100 | #214 | Poor 5.4% |
| Delaware | 14.7 /100 | #215 | Poor 5.4% |
| Immigrants | South America | 13.5 /100 | #216 | Poor 5.4% |
Demographics Similar to Alsatians by Unemployment
In terms of unemployment, the demographic groups most similar to Alsatians are Costa Rican (5.3%, a difference of 0.020%), Immigrants from Uganda (5.3%, a difference of 0.050%), Immigrants from Belarus (5.3%, a difference of 0.090%), Arab (5.3%, a difference of 0.11%), and Immigrants from Thailand (5.3%, a difference of 0.12%).
| Demographics | Rating | Rank | Unemployment |
| Albanians | 43.5 /100 | #181 | Average 5.3% |
| Spaniards | 42.2 /100 | #182 | Average 5.3% |
| Brazilians | 40.2 /100 | #183 | Average 5.3% |
| Assyrians/Chaldeans/Syriacs | 39.2 /100 | #184 | Fair 5.3% |
| Immigrants | Thailand | 38.9 /100 | #185 | Fair 5.3% |
| Immigrants | Uganda | 37.8 /100 | #186 | Fair 5.3% |
| Costa Ricans | 37.4 /100 | #187 | Fair 5.3% |
| Alsatians | 37.0 /100 | #188 | Fair 5.3% |
| Immigrants | Belarus | 35.6 /100 | #189 | Fair 5.3% |
| Arabs | 35.3 /100 | #190 | Fair 5.3% |
| Somalis | 34.0 /100 | #191 | Fair 5.3% |
| South Americans | 33.9 /100 | #192 | Fair 5.3% |
| Immigrants | Somalia | 33.8 /100 | #193 | Fair 5.3% |
| Immigrants | Laos | 30.9 /100 | #194 | Fair 5.3% |
| Immigrants | Southern Europe | 30.9 /100 | #195 | Fair 5.3% |