Immigrants from Eastern Asia vs Alsatian Unemployment
COMPARE
Immigrants from Eastern Asia
Alsatian
Unemployment
Unemployment Comparison
Immigrants from Eastern Asia
Alsatians
5.1%
UNEMPLOYMENT
88.3/ 100
METRIC RATING
125th/ 347
METRIC RANK
5.3%
UNEMPLOYMENT
37.0/ 100
METRIC RATING
188th/ 347
METRIC RANK
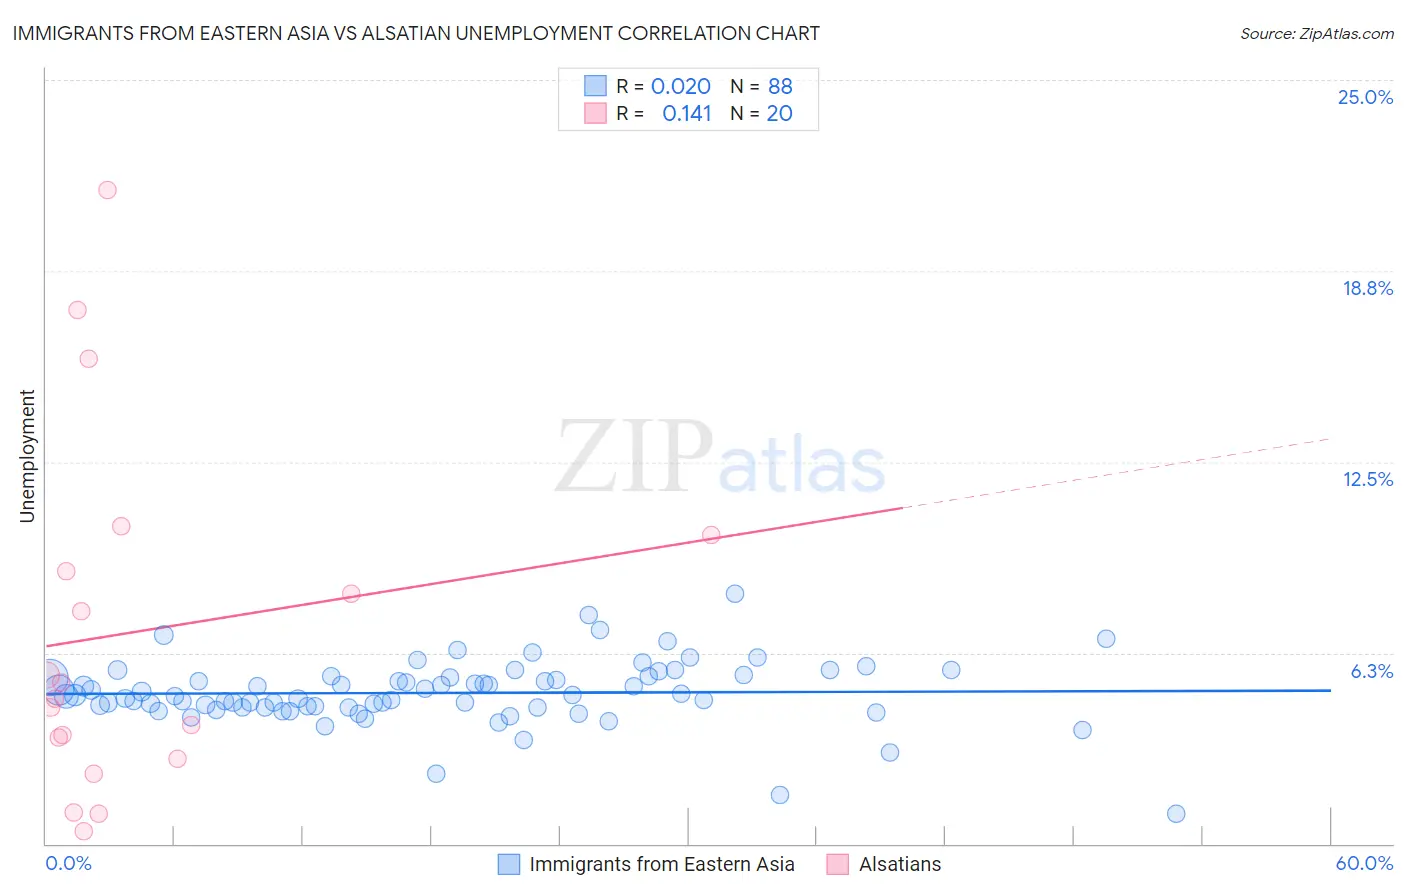
Immigrants from Eastern Asia vs Alsatian Unemployment Correlation Chart
The statistical analysis conducted on geographies consisting of 498,945,317 people shows no correlation between the proportion of Immigrants from Eastern Asia and unemployment in the United States with a correlation coefficient (R) of 0.020 and weighted average of 5.1%. Similarly, the statistical analysis conducted on geographies consisting of 82,657,373 people shows a poor positive correlation between the proportion of Alsatians and unemployment in the United States with a correlation coefficient (R) of 0.141 and weighted average of 5.3%, a difference of 4.1%.
Unemployment Correlation Summary
| Measurement | Immigrants from Eastern Asia | Alsatian |
| Minimum | 1.0% | 0.40% |
| Maximum | 8.2% | 21.4% |
| Range | 7.2% | 21.0% |
| Mean | 4.9% | 6.9% |
| Median | 4.8% | 5.0% |
| Interquartile 25% (IQ1) | 4.5% | 3.1% |
| Interquartile 75% (IQ3) | 5.5% | 9.5% |
| Interquartile Range (IQR) | 0.99% | 6.4% |
| Standard Deviation (Sample) | 1.1% | 5.7% |
| Standard Deviation (Population) | 1.1% | 5.6% |
Similar Demographics by Unemployment
Demographics Similar to Immigrants from Eastern Asia by Unemployment
In terms of unemployment, the demographic groups most similar to Immigrants from Eastern Asia are Kenyan (5.1%, a difference of 0.020%), Immigrants from Kenya (5.1%, a difference of 0.020%), Immigrants from Eastern Africa (5.1%, a difference of 0.040%), Immigrants from Latvia (5.1%, a difference of 0.040%), and Ethiopian (5.1%, a difference of 0.050%).
| Demographics | Rating | Rank | Unemployment |
| Immigrants | Germany | 90.8 /100 | #118 | Exceptional 5.1% |
| Immigrants | France | 89.7 /100 | #119 | Excellent 5.1% |
| Macedonians | 89.7 /100 | #120 | Excellent 5.1% |
| Lebanese | 89.2 /100 | #121 | Excellent 5.1% |
| Immigrants | Switzerland | 89.1 /100 | #122 | Excellent 5.1% |
| Asians | 89.0 /100 | #123 | Excellent 5.1% |
| Ethiopians | 88.6 /100 | #124 | Excellent 5.1% |
| Immigrants | Eastern Asia | 88.3 /100 | #125 | Excellent 5.1% |
| Kenyans | 88.2 /100 | #126 | Excellent 5.1% |
| Immigrants | Kenya | 88.2 /100 | #127 | Excellent 5.1% |
| Immigrants | Eastern Africa | 88.1 /100 | #128 | Excellent 5.1% |
| Immigrants | Latvia | 88.0 /100 | #129 | Excellent 5.1% |
| Iranians | 86.9 /100 | #130 | Excellent 5.1% |
| Immigrants | Croatia | 86.8 /100 | #131 | Excellent 5.1% |
| Immigrants | Ethiopia | 86.7 /100 | #132 | Excellent 5.1% |
Demographics Similar to Alsatians by Unemployment
In terms of unemployment, the demographic groups most similar to Alsatians are Costa Rican (5.3%, a difference of 0.020%), Immigrants from Uganda (5.3%, a difference of 0.050%), Immigrants from Belarus (5.3%, a difference of 0.090%), Arab (5.3%, a difference of 0.11%), and Immigrants from Thailand (5.3%, a difference of 0.12%).
| Demographics | Rating | Rank | Unemployment |
| Albanians | 43.5 /100 | #181 | Average 5.3% |
| Spaniards | 42.2 /100 | #182 | Average 5.3% |
| Brazilians | 40.2 /100 | #183 | Average 5.3% |
| Assyrians/Chaldeans/Syriacs | 39.2 /100 | #184 | Fair 5.3% |
| Immigrants | Thailand | 38.9 /100 | #185 | Fair 5.3% |
| Immigrants | Uganda | 37.8 /100 | #186 | Fair 5.3% |
| Costa Ricans | 37.4 /100 | #187 | Fair 5.3% |
| Alsatians | 37.0 /100 | #188 | Fair 5.3% |
| Immigrants | Belarus | 35.6 /100 | #189 | Fair 5.3% |
| Arabs | 35.3 /100 | #190 | Fair 5.3% |
| Somalis | 34.0 /100 | #191 | Fair 5.3% |
| South Americans | 33.9 /100 | #192 | Fair 5.3% |
| Immigrants | Somalia | 33.8 /100 | #193 | Fair 5.3% |
| Immigrants | Laos | 30.9 /100 | #194 | Fair 5.3% |
| Immigrants | Southern Europe | 30.9 /100 | #195 | Fair 5.3% |