Russian vs Immigrants from Netherlands 8th Grade
COMPARE
Russian
Immigrants from Netherlands
8th Grade
8th Grade Comparison
Russians
Immigrants from Netherlands
96.7%
8TH GRADE
99.8/ 100
METRIC RATING
55th/ 347
METRIC RANK
96.5%
8TH GRADE
99.4/ 100
METRIC RATING
76th/ 347
METRIC RANK
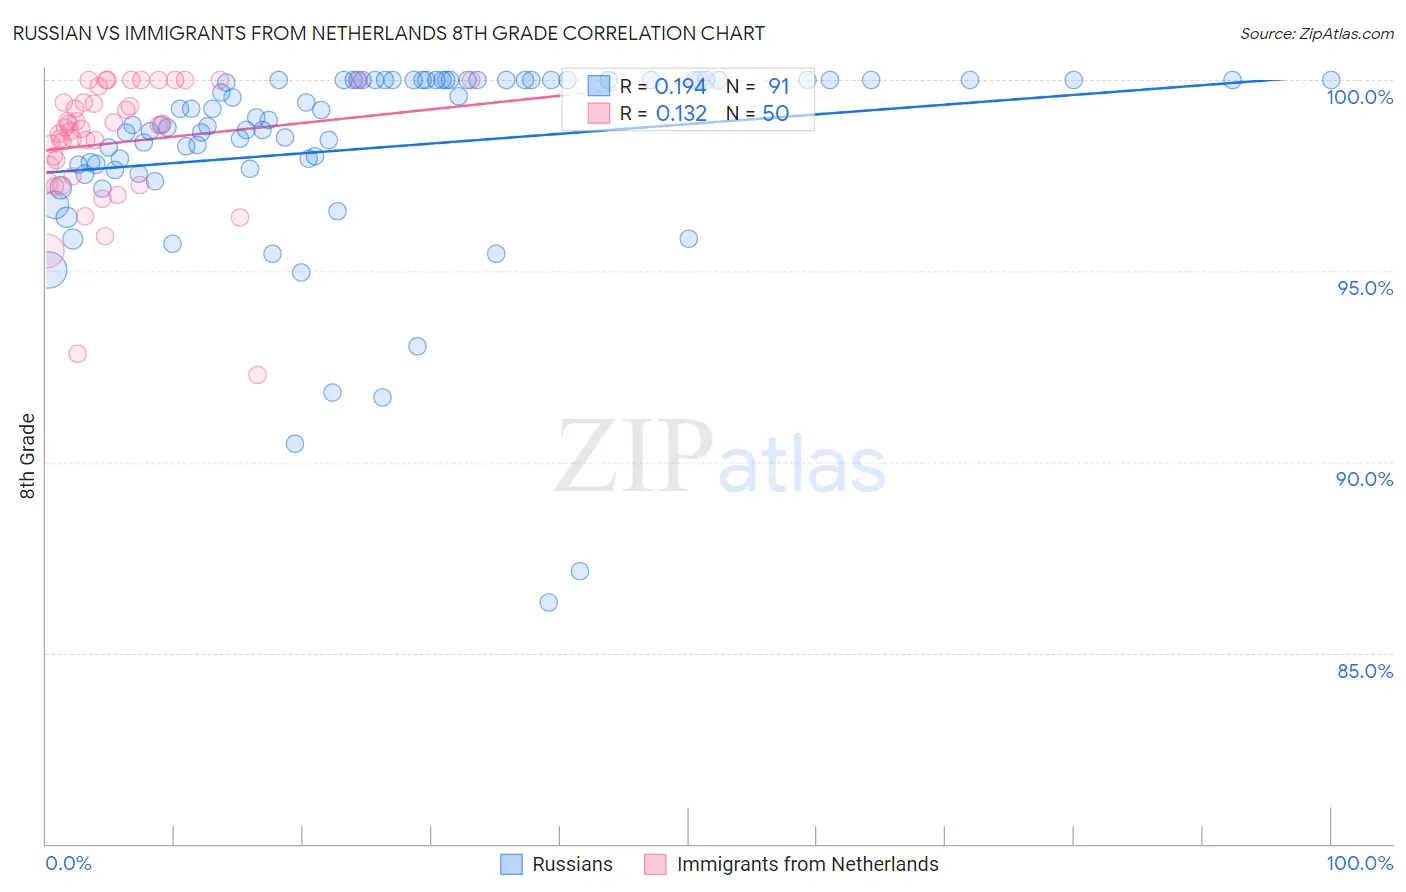
Russian vs Immigrants from Netherlands 8th Grade Correlation Chart
The statistical analysis conducted on geographies consisting of 512,259,047 people shows a poor positive correlation between the proportion of Russians and percentage of population with at least 8th grade education in the United States with a correlation coefficient (R) of 0.194 and weighted average of 96.7%. Similarly, the statistical analysis conducted on geographies consisting of 237,869,934 people shows a poor positive correlation between the proportion of Immigrants from Netherlands and percentage of population with at least 8th grade education in the United States with a correlation coefficient (R) of 0.132 and weighted average of 96.5%, a difference of 0.21%.
8th Grade Correlation Summary
| Measurement | Russian | Immigrants from Netherlands |
| Minimum | 86.3% | 92.3% |
| Maximum | 100.0% | 100.0% |
| Range | 13.7% | 7.7% |
| Mean | 98.2% | 98.4% |
| Median | 98.9% | 98.7% |
| Interquartile 25% (IQ1) | 97.7% | 97.5% |
| Interquartile 75% (IQ3) | 100.0% | 99.4% |
| Interquartile Range (IQR) | 2.3% | 1.9% |
| Standard Deviation (Sample) | 2.6% | 1.7% |
| Standard Deviation (Population) | 2.6% | 1.7% |
Similar Demographics by 8th Grade
Demographics Similar to Russians by 8th Grade
In terms of 8th grade, the demographic groups most similar to Russians are Serbian (96.7%, a difference of 0.0%), Australian (96.7%, a difference of 0.0%), Austrian (96.7%, a difference of 0.010%), Macedonian (96.7%, a difference of 0.010%), and Greek (96.8%, a difference of 0.030%).
| Demographics | Rating | Rank | 8th Grade |
| Slavs | 99.9 /100 | #48 | Exceptional 96.8% |
| Estonians | 99.9 /100 | #49 | Exceptional 96.8% |
| Immigrants | Scotland | 99.9 /100 | #50 | Exceptional 96.8% |
| Celtics | 99.9 /100 | #51 | Exceptional 96.8% |
| Greeks | 99.9 /100 | #52 | Exceptional 96.8% |
| Austrians | 99.9 /100 | #53 | Exceptional 96.7% |
| Serbians | 99.8 /100 | #54 | Exceptional 96.7% |
| Russians | 99.8 /100 | #55 | Exceptional 96.7% |
| Australians | 99.8 /100 | #56 | Exceptional 96.7% |
| Macedonians | 99.8 /100 | #57 | Exceptional 96.7% |
| Immigrants | Canada | 99.8 /100 | #58 | Exceptional 96.7% |
| Immigrants | North America | 99.8 /100 | #59 | Exceptional 96.7% |
| Immigrants | Northern Europe | 99.8 /100 | #60 | Exceptional 96.7% |
| Immigrants | Austria | 99.8 /100 | #61 | Exceptional 96.7% |
| Whites/Caucasians | 99.8 /100 | #62 | Exceptional 96.7% |
Demographics Similar to Immigrants from Netherlands by 8th Grade
In terms of 8th grade, the demographic groups most similar to Immigrants from Netherlands are Zimbabwean (96.5%, a difference of 0.0%), Cypriot (96.5%, a difference of 0.0%), Immigrants from Ireland (96.5%, a difference of 0.010%), Yugoslavian (96.5%, a difference of 0.010%), and New Zealander (96.6%, a difference of 0.020%).
| Demographics | Rating | Rank | 8th Grade |
| Americans | 99.7 /100 | #69 | Exceptional 96.6% |
| Immigrants | Lithuania | 99.6 /100 | #70 | Exceptional 96.6% |
| New Zealanders | 99.5 /100 | #71 | Exceptional 96.6% |
| Immigrants | England | 99.5 /100 | #72 | Exceptional 96.6% |
| Arapaho | 99.5 /100 | #73 | Exceptional 96.6% |
| Immigrants | Ireland | 99.5 /100 | #74 | Exceptional 96.5% |
| Zimbabweans | 99.4 /100 | #75 | Exceptional 96.5% |
| Immigrants | Netherlands | 99.4 /100 | #76 | Exceptional 96.5% |
| Cypriots | 99.4 /100 | #77 | Exceptional 96.5% |
| Yugoslavians | 99.4 /100 | #78 | Exceptional 96.5% |
| Puget Sound Salish | 99.3 /100 | #79 | Exceptional 96.5% |
| Delaware | 99.2 /100 | #80 | Exceptional 96.5% |
| Romanians | 99.2 /100 | #81 | Exceptional 96.5% |
| Turks | 99.2 /100 | #82 | Exceptional 96.5% |
| Icelanders | 99.2 /100 | #83 | Exceptional 96.5% |