Puget Sound Salish vs Kiowa Unemployment Among Seniors over 75 years
COMPARE
Puget Sound Salish
Kiowa
Unemployment Among Seniors over 75 years
Unemployment Among Seniors over 75 years Comparison
Puget Sound Salish
Kiowa
10.0%
UNEMPLOYMENT AMONG SENIORS OVER 75 YEARS
0.0/ 100
METRIC RATING
303rd/ 347
METRIC RANK
7.7%
UNEMPLOYMENT AMONG SENIORS OVER 75 YEARS
100.0/ 100
METRIC RATING
38th/ 347
METRIC RANK
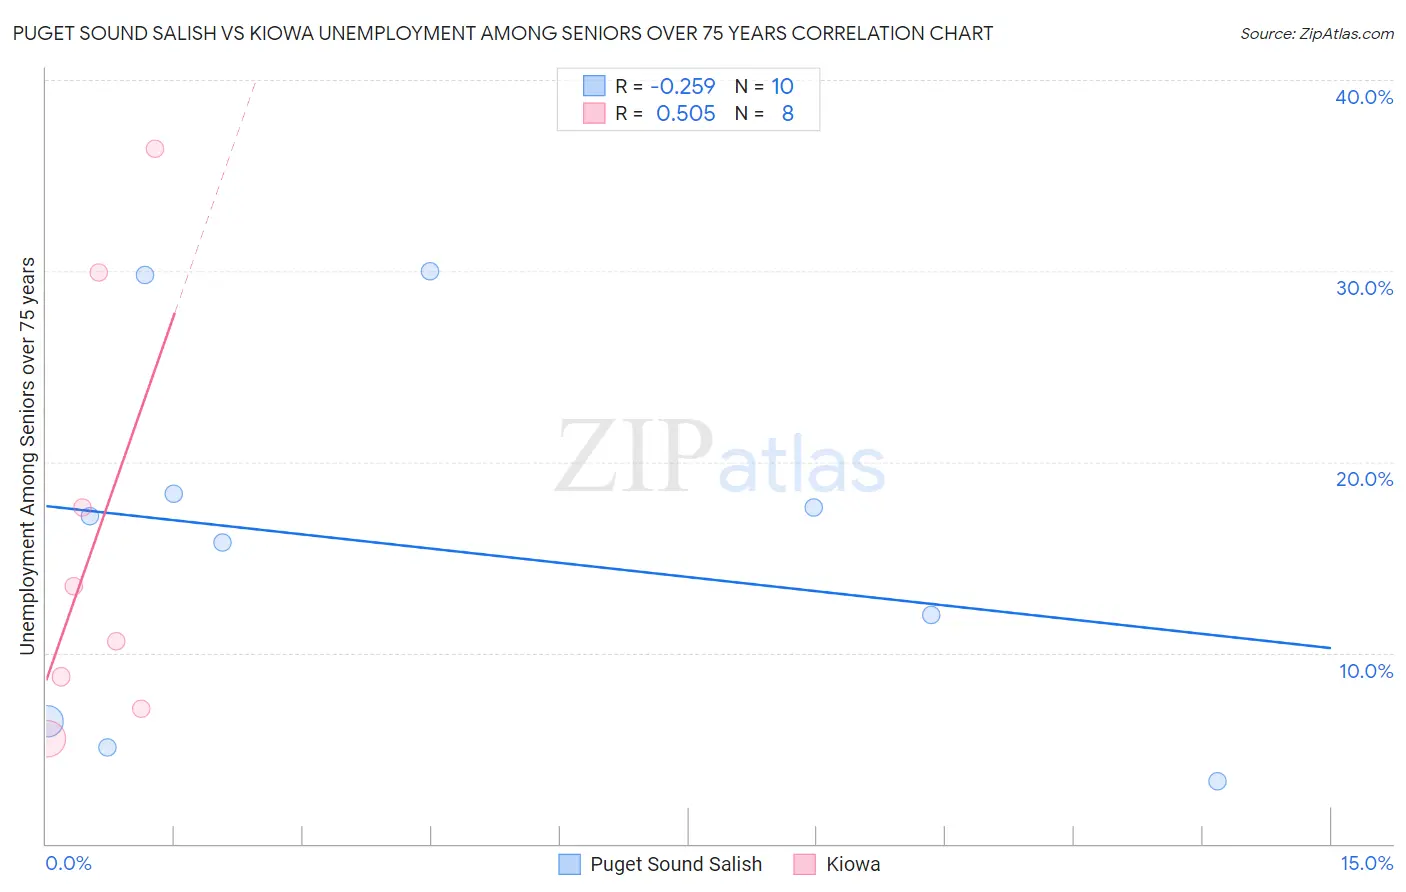
Puget Sound Salish vs Kiowa Unemployment Among Seniors over 75 years Correlation Chart
The statistical analysis conducted on geographies consisting of 33,735,975 people shows a weak negative correlation between the proportion of Puget Sound Salish and unemployment rate among seniors over the age of 75 in the United States with a correlation coefficient (R) of -0.259 and weighted average of 10.0%. Similarly, the statistical analysis conducted on geographies consisting of 46,224,315 people shows a substantial positive correlation between the proportion of Kiowa and unemployment rate among seniors over the age of 75 in the United States with a correlation coefficient (R) of 0.505 and weighted average of 7.7%, a difference of 29.4%.
Unemployment Among Seniors over 75 years Correlation Summary
| Measurement | Puget Sound Salish | Kiowa |
| Minimum | 3.3% | 5.5% |
| Maximum | 30.0% | 36.4% |
| Range | 26.7% | 30.9% |
| Mean | 15.5% | 16.2% |
| Median | 16.5% | 12.0% |
| Interquartile 25% (IQ1) | 6.4% | 7.9% |
| Interquartile 75% (IQ3) | 18.3% | 23.8% |
| Interquartile Range (IQR) | 11.9% | 15.8% |
| Standard Deviation (Sample) | 9.3% | 11.3% |
| Standard Deviation (Population) | 8.9% | 10.6% |
Similar Demographics by Unemployment Among Seniors over 75 years
Demographics Similar to Puget Sound Salish by Unemployment Among Seniors over 75 years
In terms of unemployment among seniors over 75 years, the demographic groups most similar to Puget Sound Salish are Scotch-Irish (10.0%, a difference of 0.010%), Finnish (10.0%, a difference of 0.070%), Welsh (10.0%, a difference of 0.18%), Swedish (10.0%, a difference of 0.20%), and Italian (10.0%, a difference of 0.35%).
| Demographics | Rating | Rank | Unemployment Among Seniors over 75 years |
| Immigrants | St. Vincent and the Grenadines | 0.0 /100 | #296 | Tragic 9.8% |
| Cherokee | 0.0 /100 | #297 | Tragic 9.8% |
| Lithuanians | 0.0 /100 | #298 | Tragic 9.9% |
| Belgians | 0.0 /100 | #299 | Tragic 9.9% |
| Iraqis | 0.0 /100 | #300 | Tragic 9.9% |
| Welsh | 0.0 /100 | #301 | Tragic 10.0% |
| Finns | 0.0 /100 | #302 | Tragic 10.0% |
| Puget Sound Salish | 0.0 /100 | #303 | Tragic 10.0% |
| Scotch-Irish | 0.0 /100 | #304 | Tragic 10.0% |
| Swedes | 0.0 /100 | #305 | Tragic 10.0% |
| Italians | 0.0 /100 | #306 | Tragic 10.0% |
| Immigrants | Fiji | 0.0 /100 | #307 | Tragic 10.0% |
| Whites/Caucasians | 0.0 /100 | #308 | Tragic 10.1% |
| English | 0.0 /100 | #309 | Tragic 10.1% |
| Hungarians | 0.0 /100 | #310 | Tragic 10.1% |
Demographics Similar to Kiowa by Unemployment Among Seniors over 75 years
In terms of unemployment among seniors over 75 years, the demographic groups most similar to Kiowa are Immigrants from Hungary (7.7%, a difference of 0.020%), Ugandan (7.7%, a difference of 0.040%), Colville (7.7%, a difference of 0.060%), Immigrants from Burma/Myanmar (7.7%, a difference of 0.20%), and Luxembourger (7.7%, a difference of 0.22%).
| Demographics | Rating | Rank | Unemployment Among Seniors over 75 years |
| Guyanese | 100.0 /100 | #31 | Exceptional 7.6% |
| Immigrants | Hong Kong | 100.0 /100 | #32 | Exceptional 7.6% |
| Cambodians | 100.0 /100 | #33 | Exceptional 7.6% |
| Immigrants | Eritrea | 100.0 /100 | #34 | Exceptional 7.7% |
| Immigrants | Norway | 100.0 /100 | #35 | Exceptional 7.7% |
| Luxembourgers | 100.0 /100 | #36 | Exceptional 7.7% |
| Immigrants | Hungary | 100.0 /100 | #37 | Exceptional 7.7% |
| Kiowa | 100.0 /100 | #38 | Exceptional 7.7% |
| Ugandans | 100.0 /100 | #39 | Exceptional 7.7% |
| Colville | 100.0 /100 | #40 | Exceptional 7.7% |
| Immigrants | Burma/Myanmar | 100.0 /100 | #41 | Exceptional 7.7% |
| Pueblo | 100.0 /100 | #42 | Exceptional 7.7% |
| Immigrants | Denmark | 100.0 /100 | #43 | Exceptional 7.8% |
| Immigrants | Spain | 100.0 /100 | #44 | Exceptional 7.8% |
| British West Indians | 100.0 /100 | #45 | Exceptional 7.8% |