Immigrants from Bulgaria vs Kiowa Unemployment Among Seniors over 75 years
COMPARE
Immigrants from Bulgaria
Kiowa
Unemployment Among Seniors over 75 years
Unemployment Among Seniors over 75 years Comparison
Immigrants from Bulgaria
Kiowa
8.5%
UNEMPLOYMENT AMONG SENIORS OVER 75 YEARS
89.6/ 100
METRIC RATING
138th/ 347
METRIC RANK
7.7%
UNEMPLOYMENT AMONG SENIORS OVER 75 YEARS
100.0/ 100
METRIC RATING
38th/ 347
METRIC RANK
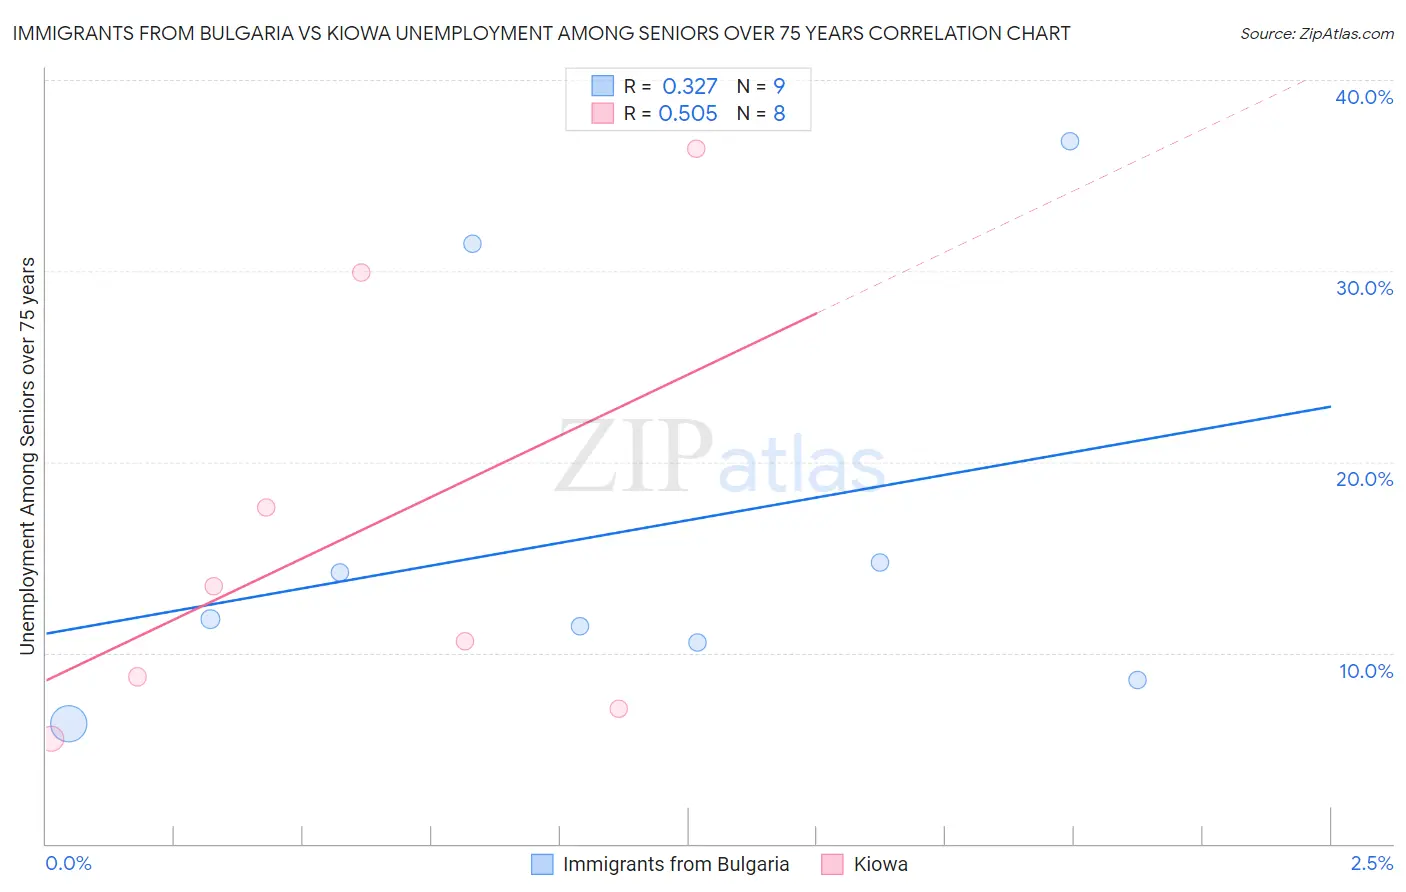
Immigrants from Bulgaria vs Kiowa Unemployment Among Seniors over 75 years Correlation Chart
The statistical analysis conducted on geographies consisting of 116,739,268 people shows a mild positive correlation between the proportion of Immigrants from Bulgaria and unemployment rate among seniors over the age of 75 in the United States with a correlation coefficient (R) of 0.327 and weighted average of 8.5%. Similarly, the statistical analysis conducted on geographies consisting of 46,224,315 people shows a substantial positive correlation between the proportion of Kiowa and unemployment rate among seniors over the age of 75 in the United States with a correlation coefficient (R) of 0.505 and weighted average of 7.7%, a difference of 10.2%.
Unemployment Among Seniors over 75 years Correlation Summary
| Measurement | Immigrants from Bulgaria | Kiowa |
| Minimum | 6.3% | 5.5% |
| Maximum | 36.8% | 36.4% |
| Range | 30.5% | 30.9% |
| Mean | 16.2% | 16.2% |
| Median | 11.8% | 12.0% |
| Interquartile 25% (IQ1) | 9.6% | 7.9% |
| Interquartile 75% (IQ3) | 23.1% | 23.8% |
| Interquartile Range (IQR) | 13.5% | 15.8% |
| Standard Deviation (Sample) | 10.6% | 11.3% |
| Standard Deviation (Population) | 10.0% | 10.6% |
Similar Demographics by Unemployment Among Seniors over 75 years
Demographics Similar to Immigrants from Bulgaria by Unemployment Among Seniors over 75 years
In terms of unemployment among seniors over 75 years, the demographic groups most similar to Immigrants from Bulgaria are Immigrants from Kuwait (8.5%, a difference of 0.14%), Barbadian (8.5%, a difference of 0.14%), Immigrants from Trinidad and Tobago (8.5%, a difference of 0.18%), South American (8.5%, a difference of 0.24%), and Immigrants from Bolivia (8.5%, a difference of 0.24%).
| Demographics | Rating | Rank | Unemployment Among Seniors over 75 years |
| German Russians | 94.9 /100 | #131 | Exceptional 8.4% |
| Chileans | 93.8 /100 | #132 | Exceptional 8.4% |
| Serbians | 93.7 /100 | #133 | Exceptional 8.4% |
| Immigrants | Czechoslovakia | 93.4 /100 | #134 | Exceptional 8.4% |
| Haitians | 91.4 /100 | #135 | Exceptional 8.5% |
| Immigrants | Trinidad and Tobago | 90.8 /100 | #136 | Exceptional 8.5% |
| Immigrants | Kuwait | 90.5 /100 | #137 | Exceptional 8.5% |
| Immigrants | Bulgaria | 89.6 /100 | #138 | Excellent 8.5% |
| Barbadians | 88.6 /100 | #139 | Excellent 8.5% |
| South Americans | 87.9 /100 | #140 | Excellent 8.5% |
| Immigrants | Bolivia | 87.9 /100 | #141 | Excellent 8.5% |
| Immigrants | Ukraine | 87.0 /100 | #142 | Excellent 8.5% |
| Immigrants | Costa Rica | 86.8 /100 | #143 | Excellent 8.5% |
| Colombians | 86.7 /100 | #144 | Excellent 8.5% |
| Immigrants | Romania | 86.2 /100 | #145 | Excellent 8.5% |
Demographics Similar to Kiowa by Unemployment Among Seniors over 75 years
In terms of unemployment among seniors over 75 years, the demographic groups most similar to Kiowa are Immigrants from Hungary (7.7%, a difference of 0.020%), Ugandan (7.7%, a difference of 0.040%), Colville (7.7%, a difference of 0.060%), Immigrants from Burma/Myanmar (7.7%, a difference of 0.20%), and Luxembourger (7.7%, a difference of 0.22%).
| Demographics | Rating | Rank | Unemployment Among Seniors over 75 years |
| Guyanese | 100.0 /100 | #31 | Exceptional 7.6% |
| Immigrants | Hong Kong | 100.0 /100 | #32 | Exceptional 7.6% |
| Cambodians | 100.0 /100 | #33 | Exceptional 7.6% |
| Immigrants | Eritrea | 100.0 /100 | #34 | Exceptional 7.7% |
| Immigrants | Norway | 100.0 /100 | #35 | Exceptional 7.7% |
| Luxembourgers | 100.0 /100 | #36 | Exceptional 7.7% |
| Immigrants | Hungary | 100.0 /100 | #37 | Exceptional 7.7% |
| Kiowa | 100.0 /100 | #38 | Exceptional 7.7% |
| Ugandans | 100.0 /100 | #39 | Exceptional 7.7% |
| Colville | 100.0 /100 | #40 | Exceptional 7.7% |
| Immigrants | Burma/Myanmar | 100.0 /100 | #41 | Exceptional 7.7% |
| Pueblo | 100.0 /100 | #42 | Exceptional 7.7% |
| Immigrants | Denmark | 100.0 /100 | #43 | Exceptional 7.8% |
| Immigrants | Spain | 100.0 /100 | #44 | Exceptional 7.8% |
| British West Indians | 100.0 /100 | #45 | Exceptional 7.8% |