Puget Sound Salish vs Tongan Unemployment Among Seniors over 75 years
COMPARE
Puget Sound Salish
Tongan
Unemployment Among Seniors over 75 years
Unemployment Among Seniors over 75 years Comparison
Puget Sound Salish
Tongans
10.0%
UNEMPLOYMENT AMONG SENIORS OVER 75 YEARS
0.0/ 100
METRIC RATING
303rd/ 347
METRIC RANK
10.4%
UNEMPLOYMENT AMONG SENIORS OVER 75 YEARS
0.0/ 100
METRIC RATING
323rd/ 347
METRIC RANK
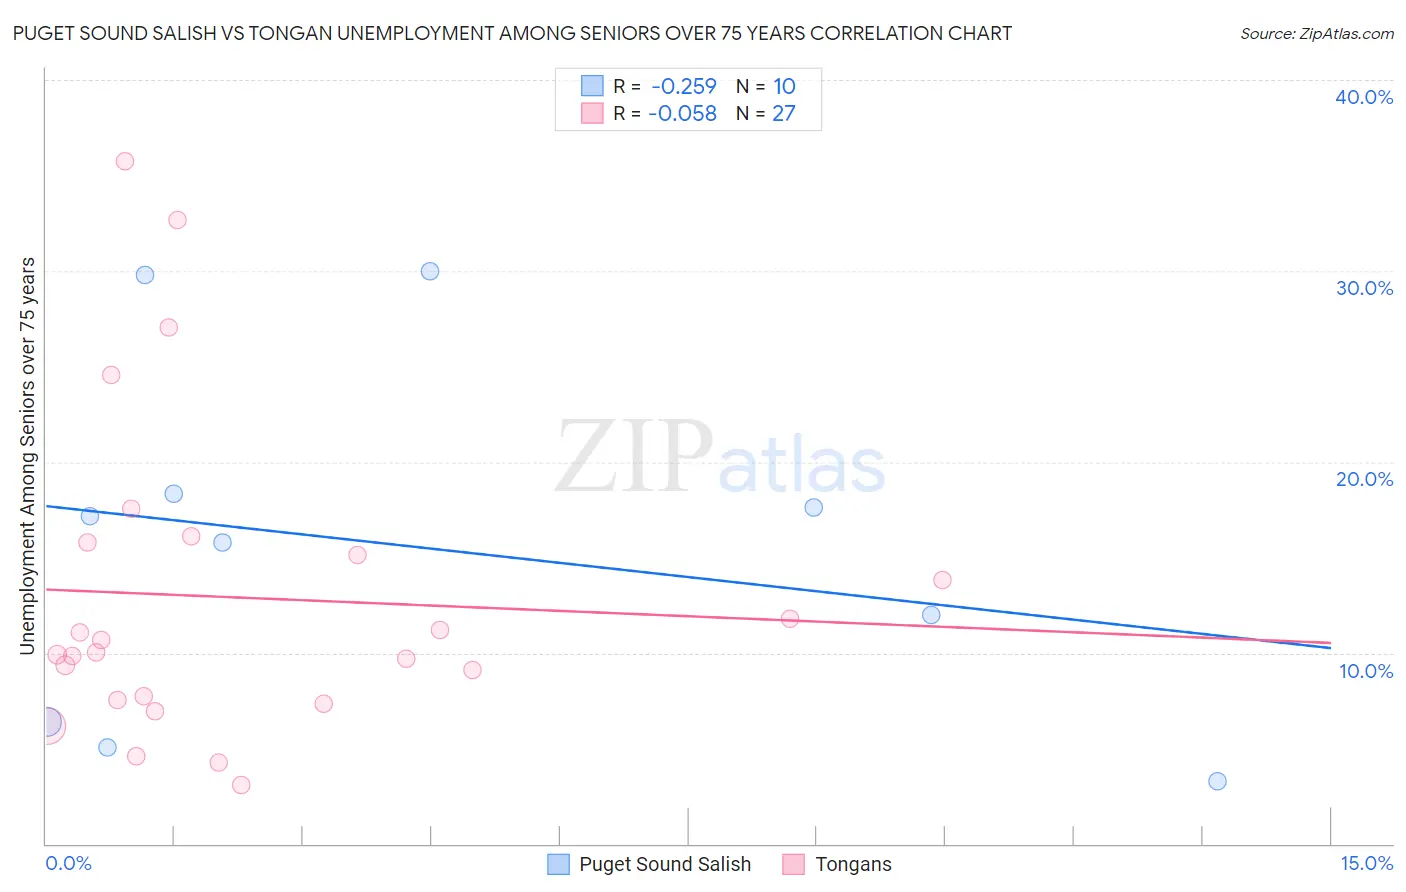
Puget Sound Salish vs Tongan Unemployment Among Seniors over 75 years Correlation Chart
The statistical analysis conducted on geographies consisting of 33,735,975 people shows a weak negative correlation between the proportion of Puget Sound Salish and unemployment rate among seniors over the age of 75 in the United States with a correlation coefficient (R) of -0.259 and weighted average of 10.0%. Similarly, the statistical analysis conducted on geographies consisting of 74,991,169 people shows a slight negative correlation between the proportion of Tongans and unemployment rate among seniors over the age of 75 in the United States with a correlation coefficient (R) of -0.058 and weighted average of 10.4%, a difference of 4.1%.
Unemployment Among Seniors over 75 years Correlation Summary
| Measurement | Puget Sound Salish | Tongan |
| Minimum | 3.3% | 3.1% |
| Maximum | 30.0% | 35.8% |
| Range | 26.7% | 32.7% |
| Mean | 15.5% | 12.9% |
| Median | 16.5% | 10.0% |
| Interquartile 25% (IQ1) | 6.4% | 7.5% |
| Interquartile 75% (IQ3) | 18.3% | 15.8% |
| Interquartile Range (IQR) | 11.9% | 8.3% |
| Standard Deviation (Sample) | 9.3% | 8.3% |
| Standard Deviation (Population) | 8.9% | 8.1% |
Demographics Similar to Puget Sound Salish and Tongans by Unemployment Among Seniors over 75 years
In terms of unemployment among seniors over 75 years, the demographic groups most similar to Puget Sound Salish are Scotch-Irish (10.0%, a difference of 0.010%), Swedish (10.0%, a difference of 0.20%), Italian (10.0%, a difference of 0.35%), Immigrants from Fiji (10.0%, a difference of 0.47%), and White/Caucasian (10.1%, a difference of 0.91%). Similarly, the demographic groups most similar to Tongans are Polish (10.3%, a difference of 0.64%), Aleut (10.3%, a difference of 0.99%), French (10.3%, a difference of 1.0%), German (10.3%, a difference of 1.2%), and Liberian (10.2%, a difference of 1.3%).
| Demographics | Rating | Rank | Unemployment Among Seniors over 75 years |
| Puget Sound Salish | 0.0 /100 | #303 | Tragic 10.0% |
| Scotch-Irish | 0.0 /100 | #304 | Tragic 10.0% |
| Swedes | 0.0 /100 | #305 | Tragic 10.0% |
| Italians | 0.0 /100 | #306 | Tragic 10.0% |
| Immigrants | Fiji | 0.0 /100 | #307 | Tragic 10.0% |
| Whites/Caucasians | 0.0 /100 | #308 | Tragic 10.1% |
| English | 0.0 /100 | #309 | Tragic 10.1% |
| Hungarians | 0.0 /100 | #310 | Tragic 10.1% |
| Scottish | 0.0 /100 | #311 | Tragic 10.1% |
| Chippewa | 0.0 /100 | #312 | Tragic 10.1% |
| Nepalese | 0.0 /100 | #313 | Tragic 10.1% |
| Dutch West Indians | 0.0 /100 | #314 | Tragic 10.2% |
| Pennsylvania Germans | 0.0 /100 | #315 | Tragic 10.2% |
| Natives/Alaskans | 0.0 /100 | #316 | Tragic 10.2% |
| Irish | 0.0 /100 | #317 | Tragic 10.2% |
| Liberians | 0.0 /100 | #318 | Tragic 10.2% |
| Germans | 0.0 /100 | #319 | Tragic 10.3% |
| French | 0.0 /100 | #320 | Tragic 10.3% |
| Aleuts | 0.0 /100 | #321 | Tragic 10.3% |
| Poles | 0.0 /100 | #322 | Tragic 10.3% |
| Tongans | 0.0 /100 | #323 | Tragic 10.4% |