Puget Sound Salish vs African Unemployment Among Seniors over 75 years
COMPARE
Puget Sound Salish
African
Unemployment Among Seniors over 75 years
Unemployment Among Seniors over 75 years Comparison
Puget Sound Salish
Africans
10.0%
UNEMPLOYMENT AMONG SENIORS OVER 75 YEARS
0.0/ 100
METRIC RATING
303rd/ 347
METRIC RANK
9.1%
UNEMPLOYMENT AMONG SENIORS OVER 75 YEARS
4.9/ 100
METRIC RATING
232nd/ 347
METRIC RANK
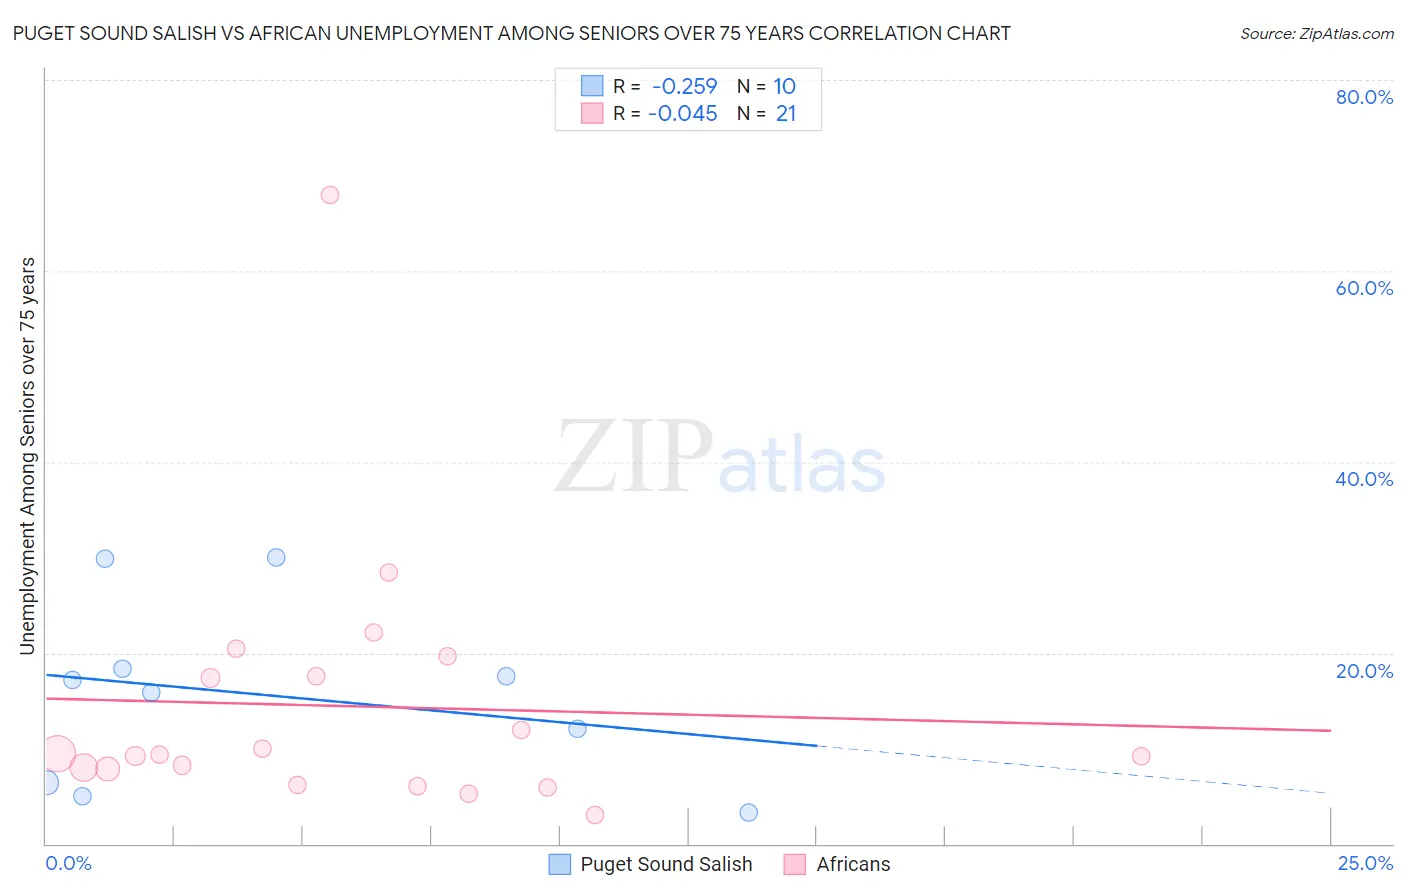
Puget Sound Salish vs African Unemployment Among Seniors over 75 years Correlation Chart
The statistical analysis conducted on geographies consisting of 33,735,975 people shows a weak negative correlation between the proportion of Puget Sound Salish and unemployment rate among seniors over the age of 75 in the United States with a correlation coefficient (R) of -0.259 and weighted average of 10.0%. Similarly, the statistical analysis conducted on geographies consisting of 219,473,985 people shows no correlation between the proportion of Africans and unemployment rate among seniors over the age of 75 in the United States with a correlation coefficient (R) of -0.045 and weighted average of 9.1%, a difference of 9.7%.
Unemployment Among Seniors over 75 years Correlation Summary
| Measurement | Puget Sound Salish | African |
| Minimum | 3.3% | 3.0% |
| Maximum | 30.0% | 67.9% |
| Range | 26.7% | 64.9% |
| Mean | 15.5% | 14.4% |
| Median | 16.5% | 9.3% |
| Interquartile 25% (IQ1) | 6.4% | 7.0% |
| Interquartile 75% (IQ3) | 18.3% | 18.6% |
| Interquartile Range (IQR) | 11.9% | 11.6% |
| Standard Deviation (Sample) | 9.3% | 13.9% |
| Standard Deviation (Population) | 8.9% | 13.6% |
Similar Demographics by Unemployment Among Seniors over 75 years
Demographics Similar to Puget Sound Salish by Unemployment Among Seniors over 75 years
In terms of unemployment among seniors over 75 years, the demographic groups most similar to Puget Sound Salish are Scotch-Irish (10.0%, a difference of 0.010%), Finnish (10.0%, a difference of 0.070%), Welsh (10.0%, a difference of 0.18%), Swedish (10.0%, a difference of 0.20%), and Italian (10.0%, a difference of 0.35%).
| Demographics | Rating | Rank | Unemployment Among Seniors over 75 years |
| Immigrants | St. Vincent and the Grenadines | 0.0 /100 | #296 | Tragic 9.8% |
| Cherokee | 0.0 /100 | #297 | Tragic 9.8% |
| Lithuanians | 0.0 /100 | #298 | Tragic 9.9% |
| Belgians | 0.0 /100 | #299 | Tragic 9.9% |
| Iraqis | 0.0 /100 | #300 | Tragic 9.9% |
| Welsh | 0.0 /100 | #301 | Tragic 10.0% |
| Finns | 0.0 /100 | #302 | Tragic 10.0% |
| Puget Sound Salish | 0.0 /100 | #303 | Tragic 10.0% |
| Scotch-Irish | 0.0 /100 | #304 | Tragic 10.0% |
| Swedes | 0.0 /100 | #305 | Tragic 10.0% |
| Italians | 0.0 /100 | #306 | Tragic 10.0% |
| Immigrants | Fiji | 0.0 /100 | #307 | Tragic 10.0% |
| Whites/Caucasians | 0.0 /100 | #308 | Tragic 10.1% |
| English | 0.0 /100 | #309 | Tragic 10.1% |
| Hungarians | 0.0 /100 | #310 | Tragic 10.1% |
Demographics Similar to Africans by Unemployment Among Seniors over 75 years
In terms of unemployment among seniors over 75 years, the demographic groups most similar to Africans are Northern European (9.1%, a difference of 0.020%), Immigrants from Central America (9.1%, a difference of 0.020%), Yugoslavian (9.1%, a difference of 0.020%), Hispanic or Latino (9.1%, a difference of 0.030%), and Vietnamese (9.1%, a difference of 0.070%).
| Demographics | Rating | Rank | Unemployment Among Seniors over 75 years |
| Navajo | 6.1 /100 | #225 | Tragic 9.1% |
| Immigrants | Bangladesh | 5.9 /100 | #226 | Tragic 9.1% |
| Samoans | 5.7 /100 | #227 | Tragic 9.1% |
| Kenyans | 5.4 /100 | #228 | Tragic 9.1% |
| Hispanics or Latinos | 5.0 /100 | #229 | Tragic 9.1% |
| Northern Europeans | 4.9 /100 | #230 | Tragic 9.1% |
| Immigrants | Central America | 4.9 /100 | #231 | Tragic 9.1% |
| Africans | 4.9 /100 | #232 | Tragic 9.1% |
| Yugoslavians | 4.8 /100 | #233 | Tragic 9.1% |
| Vietnamese | 4.6 /100 | #234 | Tragic 9.1% |
| Panamanians | 4.0 /100 | #235 | Tragic 9.1% |
| Jordanians | 4.0 /100 | #236 | Tragic 9.1% |
| Houma | 3.9 /100 | #237 | Tragic 9.1% |
| Inupiat | 3.6 /100 | #238 | Tragic 9.1% |
| Mexicans | 3.5 /100 | #239 | Tragic 9.1% |