Puget Sound Salish vs Lithuanian Unemployment Among Seniors over 75 years
COMPARE
Puget Sound Salish
Lithuanian
Unemployment Among Seniors over 75 years
Unemployment Among Seniors over 75 years Comparison
Puget Sound Salish
Lithuanians
10.0%
UNEMPLOYMENT AMONG SENIORS OVER 75 YEARS
0.0/ 100
METRIC RATING
303rd/ 347
METRIC RANK
9.9%
UNEMPLOYMENT AMONG SENIORS OVER 75 YEARS
0.0/ 100
METRIC RATING
298th/ 347
METRIC RANK
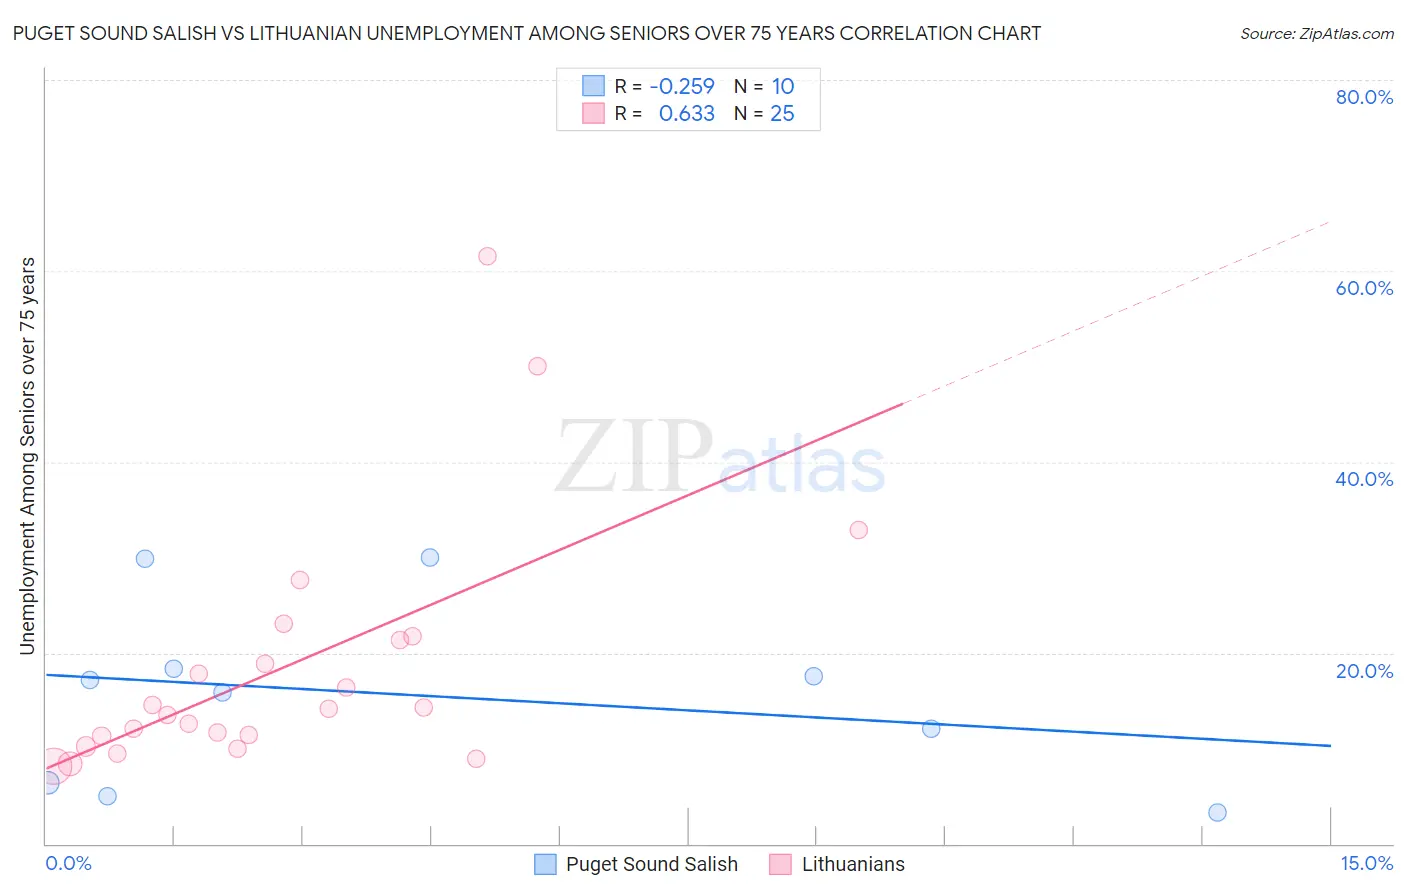
Puget Sound Salish vs Lithuanian Unemployment Among Seniors over 75 years Correlation Chart
The statistical analysis conducted on geographies consisting of 33,735,975 people shows a weak negative correlation between the proportion of Puget Sound Salish and unemployment rate among seniors over the age of 75 in the United States with a correlation coefficient (R) of -0.259 and weighted average of 10.0%. Similarly, the statistical analysis conducted on geographies consisting of 208,094,168 people shows a significant positive correlation between the proportion of Lithuanians and unemployment rate among seniors over the age of 75 in the United States with a correlation coefficient (R) of 0.633 and weighted average of 9.9%, a difference of 0.91%.
Unemployment Among Seniors over 75 years Correlation Summary
| Measurement | Puget Sound Salish | Lithuanian |
| Minimum | 3.3% | 8.1% |
| Maximum | 30.0% | 61.5% |
| Range | 26.7% | 53.4% |
| Mean | 15.5% | 18.5% |
| Median | 16.5% | 14.2% |
| Interquartile 25% (IQ1) | 6.4% | 10.8% |
| Interquartile 75% (IQ3) | 18.3% | 21.5% |
| Interquartile Range (IQR) | 11.9% | 10.8% |
| Standard Deviation (Sample) | 9.3% | 12.9% |
| Standard Deviation (Population) | 8.9% | 12.7% |
Demographics Similar to Puget Sound Salish and Lithuanians by Unemployment Among Seniors over 75 years
In terms of unemployment among seniors over 75 years, the demographic groups most similar to Puget Sound Salish are Scotch-Irish (10.0%, a difference of 0.010%), Finnish (10.0%, a difference of 0.070%), Welsh (10.0%, a difference of 0.18%), Swedish (10.0%, a difference of 0.20%), and Italian (10.0%, a difference of 0.35%). Similarly, the demographic groups most similar to Lithuanians are Belgian (9.9%, a difference of 0.28%), Iraqi (9.9%, a difference of 0.30%), Cherokee (9.8%, a difference of 0.38%), Immigrants from St. Vincent and the Grenadines (9.8%, a difference of 0.46%), and Nonimmigrants (9.8%, a difference of 0.51%).
| Demographics | Rating | Rank | Unemployment Among Seniors over 75 years |
| Sioux | 0.0 /100 | #290 | Tragic 9.7% |
| Scandinavians | 0.0 /100 | #291 | Tragic 9.7% |
| Immigrants | Western Africa | 0.0 /100 | #292 | Tragic 9.8% |
| Norwegians | 0.0 /100 | #293 | Tragic 9.8% |
| Immigrants | Dominica | 0.0 /100 | #294 | Tragic 9.8% |
| Immigrants | Nonimmigrants | 0.0 /100 | #295 | Tragic 9.8% |
| Immigrants | St. Vincent and the Grenadines | 0.0 /100 | #296 | Tragic 9.8% |
| Cherokee | 0.0 /100 | #297 | Tragic 9.8% |
| Lithuanians | 0.0 /100 | #298 | Tragic 9.9% |
| Belgians | 0.0 /100 | #299 | Tragic 9.9% |
| Iraqis | 0.0 /100 | #300 | Tragic 9.9% |
| Welsh | 0.0 /100 | #301 | Tragic 10.0% |
| Finns | 0.0 /100 | #302 | Tragic 10.0% |
| Puget Sound Salish | 0.0 /100 | #303 | Tragic 10.0% |
| Scotch-Irish | 0.0 /100 | #304 | Tragic 10.0% |
| Swedes | 0.0 /100 | #305 | Tragic 10.0% |
| Italians | 0.0 /100 | #306 | Tragic 10.0% |
| Immigrants | Fiji | 0.0 /100 | #307 | Tragic 10.0% |
| Whites/Caucasians | 0.0 /100 | #308 | Tragic 10.1% |
| English | 0.0 /100 | #309 | Tragic 10.1% |
| Hungarians | 0.0 /100 | #310 | Tragic 10.1% |