Immigrants from South Eastern Asia vs Kiowa Unemployment Among Seniors over 75 years
COMPARE
Immigrants from South Eastern Asia
Kiowa
Unemployment Among Seniors over 75 years
Unemployment Among Seniors over 75 years Comparison
Immigrants from South Eastern Asia
Kiowa
8.5%
UNEMPLOYMENT AMONG SENIORS OVER 75 YEARS
85.8/ 100
METRIC RATING
146th/ 347
METRIC RANK
7.7%
UNEMPLOYMENT AMONG SENIORS OVER 75 YEARS
100.0/ 100
METRIC RATING
38th/ 347
METRIC RANK
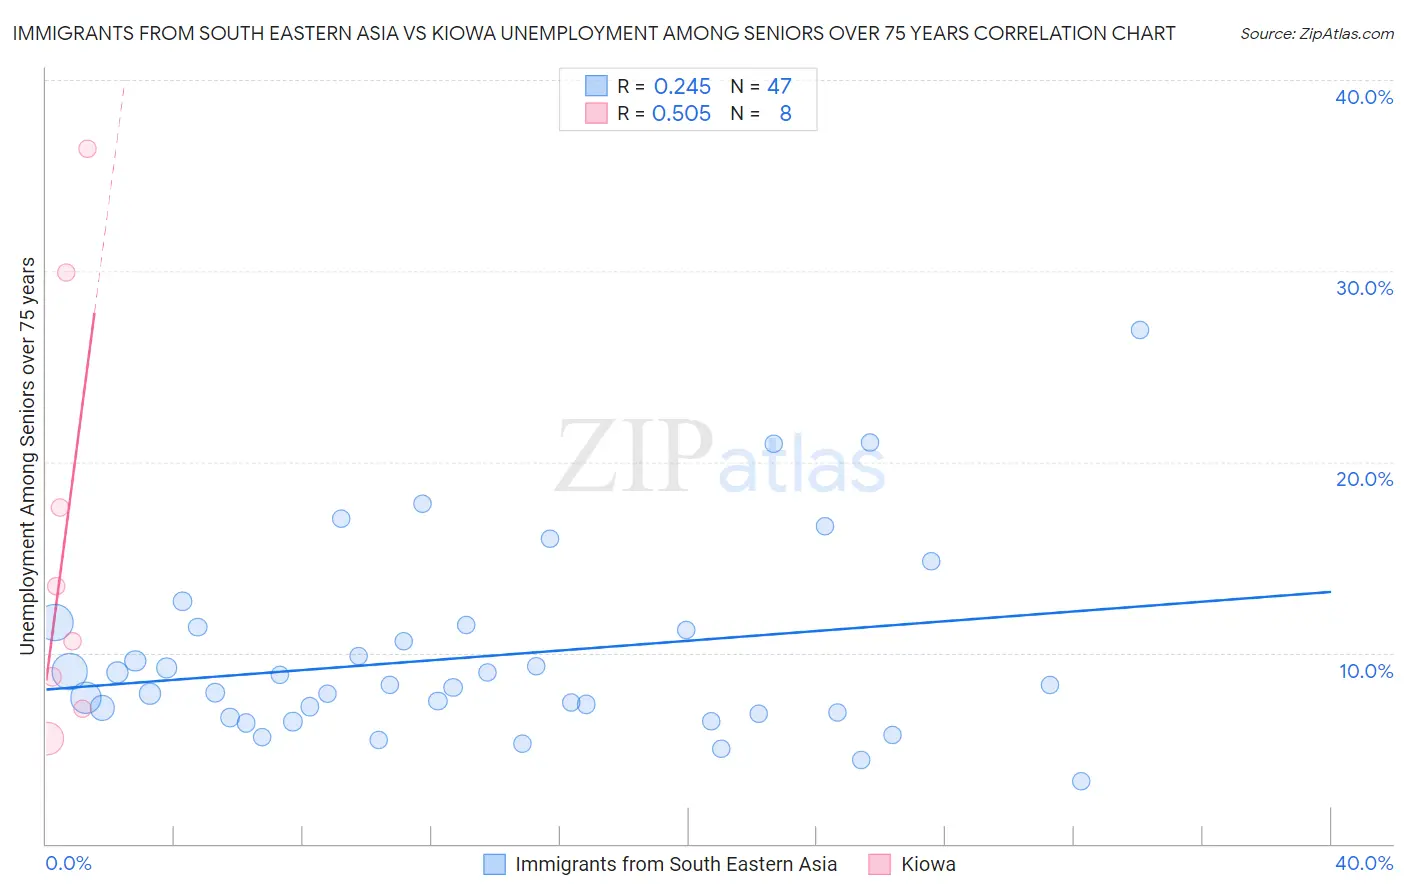
Immigrants from South Eastern Asia vs Kiowa Unemployment Among Seniors over 75 years Correlation Chart
The statistical analysis conducted on geographies consisting of 228,346,065 people shows a weak positive correlation between the proportion of Immigrants from South Eastern Asia and unemployment rate among seniors over the age of 75 in the United States with a correlation coefficient (R) of 0.245 and weighted average of 8.5%. Similarly, the statistical analysis conducted on geographies consisting of 46,224,315 people shows a substantial positive correlation between the proportion of Kiowa and unemployment rate among seniors over the age of 75 in the United States with a correlation coefficient (R) of 0.505 and weighted average of 7.7%, a difference of 10.7%.
Unemployment Among Seniors over 75 years Correlation Summary
| Measurement | Immigrants from South Eastern Asia | Kiowa |
| Minimum | 3.3% | 5.5% |
| Maximum | 26.9% | 36.4% |
| Range | 23.6% | 30.9% |
| Mean | 9.8% | 16.2% |
| Median | 8.3% | 12.0% |
| Interquartile 25% (IQ1) | 6.8% | 7.9% |
| Interquartile 75% (IQ3) | 11.3% | 23.8% |
| Interquartile Range (IQR) | 4.6% | 15.8% |
| Standard Deviation (Sample) | 4.8% | 11.3% |
| Standard Deviation (Population) | 4.8% | 10.6% |
Similar Demographics by Unemployment Among Seniors over 75 years
Demographics Similar to Immigrants from South Eastern Asia by Unemployment Among Seniors over 75 years
In terms of unemployment among seniors over 75 years, the demographic groups most similar to Immigrants from South Eastern Asia are Immigrants from Sierra Leone (8.5%, a difference of 0.020%), Immigrants from Colombia (8.5%, a difference of 0.020%), Immigrants from Romania (8.5%, a difference of 0.050%), Colombian (8.5%, a difference of 0.11%), and Immigrants from Costa Rica (8.5%, a difference of 0.12%).
| Demographics | Rating | Rank | Unemployment Among Seniors over 75 years |
| Barbadians | 88.6 /100 | #139 | Excellent 8.5% |
| South Americans | 87.9 /100 | #140 | Excellent 8.5% |
| Immigrants | Bolivia | 87.9 /100 | #141 | Excellent 8.5% |
| Immigrants | Ukraine | 87.0 /100 | #142 | Excellent 8.5% |
| Immigrants | Costa Rica | 86.8 /100 | #143 | Excellent 8.5% |
| Colombians | 86.7 /100 | #144 | Excellent 8.5% |
| Immigrants | Romania | 86.2 /100 | #145 | Excellent 8.5% |
| Immigrants | South Eastern Asia | 85.8 /100 | #146 | Excellent 8.5% |
| Immigrants | Sierra Leone | 85.6 /100 | #147 | Excellent 8.5% |
| Immigrants | Colombia | 85.6 /100 | #148 | Excellent 8.5% |
| Immigrants | Ecuador | 84.6 /100 | #149 | Excellent 8.5% |
| Paiute | 82.5 /100 | #150 | Excellent 8.6% |
| Immigrants | Bosnia and Herzegovina | 80.6 /100 | #151 | Excellent 8.6% |
| Latvians | 80.5 /100 | #152 | Excellent 8.6% |
| Mongolians | 80.1 /100 | #153 | Excellent 8.6% |
Demographics Similar to Kiowa by Unemployment Among Seniors over 75 years
In terms of unemployment among seniors over 75 years, the demographic groups most similar to Kiowa are Immigrants from Hungary (7.7%, a difference of 0.020%), Ugandan (7.7%, a difference of 0.040%), Colville (7.7%, a difference of 0.060%), Immigrants from Burma/Myanmar (7.7%, a difference of 0.20%), and Luxembourger (7.7%, a difference of 0.22%).
| Demographics | Rating | Rank | Unemployment Among Seniors over 75 years |
| Guyanese | 100.0 /100 | #31 | Exceptional 7.6% |
| Immigrants | Hong Kong | 100.0 /100 | #32 | Exceptional 7.6% |
| Cambodians | 100.0 /100 | #33 | Exceptional 7.6% |
| Immigrants | Eritrea | 100.0 /100 | #34 | Exceptional 7.7% |
| Immigrants | Norway | 100.0 /100 | #35 | Exceptional 7.7% |
| Luxembourgers | 100.0 /100 | #36 | Exceptional 7.7% |
| Immigrants | Hungary | 100.0 /100 | #37 | Exceptional 7.7% |
| Kiowa | 100.0 /100 | #38 | Exceptional 7.7% |
| Ugandans | 100.0 /100 | #39 | Exceptional 7.7% |
| Colville | 100.0 /100 | #40 | Exceptional 7.7% |
| Immigrants | Burma/Myanmar | 100.0 /100 | #41 | Exceptional 7.7% |
| Pueblo | 100.0 /100 | #42 | Exceptional 7.7% |
| Immigrants | Denmark | 100.0 /100 | #43 | Exceptional 7.8% |
| Immigrants | Spain | 100.0 /100 | #44 | Exceptional 7.8% |
| British West Indians | 100.0 /100 | #45 | Exceptional 7.8% |