Salvadoran vs Italian Unemployment Among Ages 35 to 44 years
COMPARE
Salvadoran
Italian
Unemployment Among Ages 35 to 44 years
Unemployment Among Ages 35 to 44 years Comparison
Salvadorans
Italians
5.1%
UNEMPLOYMENT AMONG AGES 35 TO 44 YEARS
0.4/ 100
METRIC RATING
243rd/ 347
METRIC RANK
4.5%
UNEMPLOYMENT AMONG AGES 35 TO 44 YEARS
91.9/ 100
METRIC RATING
100th/ 347
METRIC RANK
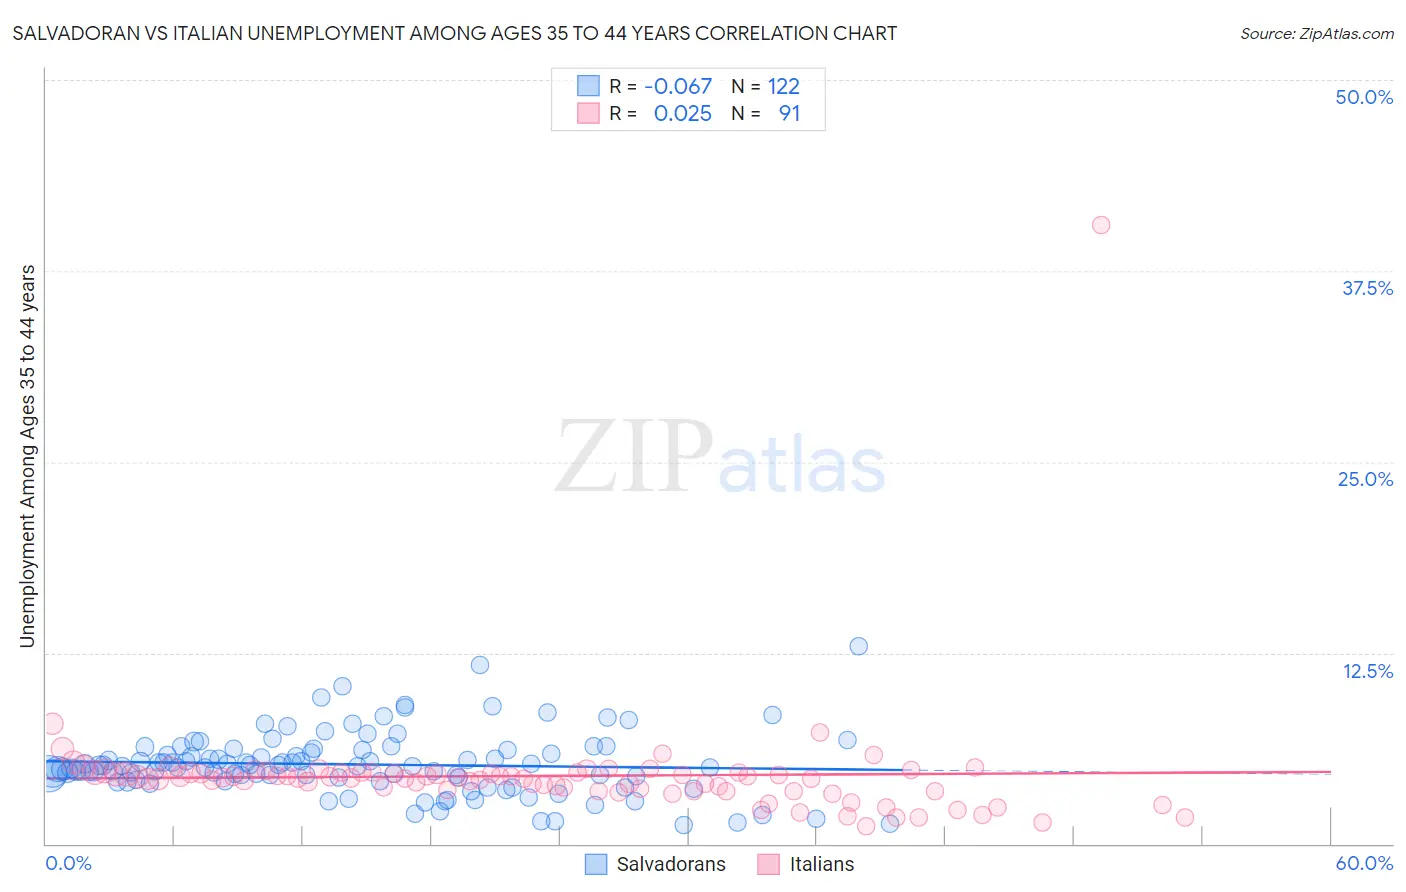
Salvadoran vs Italian Unemployment Among Ages 35 to 44 years Correlation Chart
The statistical analysis conducted on geographies consisting of 391,087,109 people shows a slight negative correlation between the proportion of Salvadorans and unemployment rate among population between the ages 35 and 44 in the United States with a correlation coefficient (R) of -0.067 and weighted average of 5.1%. Similarly, the statistical analysis conducted on geographies consisting of 534,997,275 people shows no correlation between the proportion of Italians and unemployment rate among population between the ages 35 and 44 in the United States with a correlation coefficient (R) of 0.025 and weighted average of 4.5%, a difference of 14.6%.
Unemployment Among Ages 35 to 44 years Correlation Summary
| Measurement | Salvadoran | Italian |
| Minimum | 1.2% | 1.2% |
| Maximum | 12.9% | 40.5% |
| Range | 11.7% | 39.3% |
| Mean | 5.2% | 4.4% |
| Median | 5.1% | 4.3% |
| Interquartile 25% (IQ1) | 4.2% | 3.4% |
| Interquartile 75% (IQ3) | 6.1% | 4.7% |
| Interquartile Range (IQR) | 1.9% | 1.2% |
| Standard Deviation (Sample) | 2.0% | 4.0% |
| Standard Deviation (Population) | 2.0% | 4.0% |
Similar Demographics by Unemployment Among Ages 35 to 44 years
Demographics Similar to Salvadorans by Unemployment Among Ages 35 to 44 years
In terms of unemployment among ages 35 to 44 years, the demographic groups most similar to Salvadorans are Guatemalan (5.1%, a difference of 0.0%), Delaware (5.1%, a difference of 0.12%), Bahamian (5.2%, a difference of 0.26%), Immigrants from Guatemala (5.2%, a difference of 0.26%), and Immigrants from Somalia (5.2%, a difference of 0.42%).
| Demographics | Rating | Rank | Unemployment Among Ages 35 to 44 years |
| Central Americans | 0.8 /100 | #236 | Tragic 5.1% |
| Kiowa | 0.8 /100 | #237 | Tragic 5.1% |
| Hondurans | 0.7 /100 | #238 | Tragic 5.1% |
| Nigerians | 0.7 /100 | #239 | Tragic 5.1% |
| Somalis | 0.7 /100 | #240 | Tragic 5.1% |
| Immigrants | Honduras | 0.6 /100 | #241 | Tragic 5.1% |
| Delaware | 0.5 /100 | #242 | Tragic 5.1% |
| Salvadorans | 0.4 /100 | #243 | Tragic 5.1% |
| Guatemalans | 0.4 /100 | #244 | Tragic 5.1% |
| Bahamians | 0.4 /100 | #245 | Tragic 5.2% |
| Immigrants | Guatemala | 0.4 /100 | #246 | Tragic 5.2% |
| Immigrants | Somalia | 0.3 /100 | #247 | Tragic 5.2% |
| Alsatians | 0.2 /100 | #248 | Tragic 5.2% |
| Immigrants | Liberia | 0.2 /100 | #249 | Tragic 5.2% |
| Immigrants | El Salvador | 0.2 /100 | #250 | Tragic 5.2% |
Demographics Similar to Italians by Unemployment Among Ages 35 to 44 years
In terms of unemployment among ages 35 to 44 years, the demographic groups most similar to Italians are Immigrants from Netherlands (4.5%, a difference of 0.010%), Immigrants from Sudan (4.5%, a difference of 0.040%), Welsh (4.5%, a difference of 0.070%), Immigrants from Egypt (4.5%, a difference of 0.090%), and Finnish (4.5%, a difference of 0.090%).
| Demographics | Rating | Rank | Unemployment Among Ages 35 to 44 years |
| Iranians | 93.9 /100 | #93 | Exceptional 4.5% |
| Russians | 93.8 /100 | #94 | Exceptional 4.5% |
| Yugoslavians | 93.6 /100 | #95 | Exceptional 4.5% |
| Scottish | 93.5 /100 | #96 | Exceptional 4.5% |
| Immigrants | France | 92.5 /100 | #97 | Exceptional 4.5% |
| Immigrants | Canada | 92.3 /100 | #98 | Exceptional 4.5% |
| Immigrants | Egypt | 92.3 /100 | #99 | Exceptional 4.5% |
| Italians | 91.9 /100 | #100 | Exceptional 4.5% |
| Immigrants | Netherlands | 91.9 /100 | #101 | Exceptional 4.5% |
| Immigrants | Sudan | 91.8 /100 | #102 | Exceptional 4.5% |
| Welsh | 91.6 /100 | #103 | Exceptional 4.5% |
| Finns | 91.6 /100 | #104 | Exceptional 4.5% |
| Immigrants | Saudi Arabia | 91.3 /100 | #105 | Exceptional 4.5% |
| Immigrants | North America | 91.1 /100 | #106 | Exceptional 4.5% |
| Immigrants | North Macedonia | 90.7 /100 | #107 | Exceptional 4.5% |