Fijian vs Italian Unemployment Among Ages 35 to 44 years
COMPARE
Fijian
Italian
Unemployment Among Ages 35 to 44 years
Unemployment Among Ages 35 to 44 years Comparison
Fijians
Italians
4.9%
UNEMPLOYMENT AMONG AGES 35 TO 44 YEARS
8.7/ 100
METRIC RATING
212th/ 347
METRIC RANK
4.5%
UNEMPLOYMENT AMONG AGES 35 TO 44 YEARS
91.9/ 100
METRIC RATING
100th/ 347
METRIC RANK
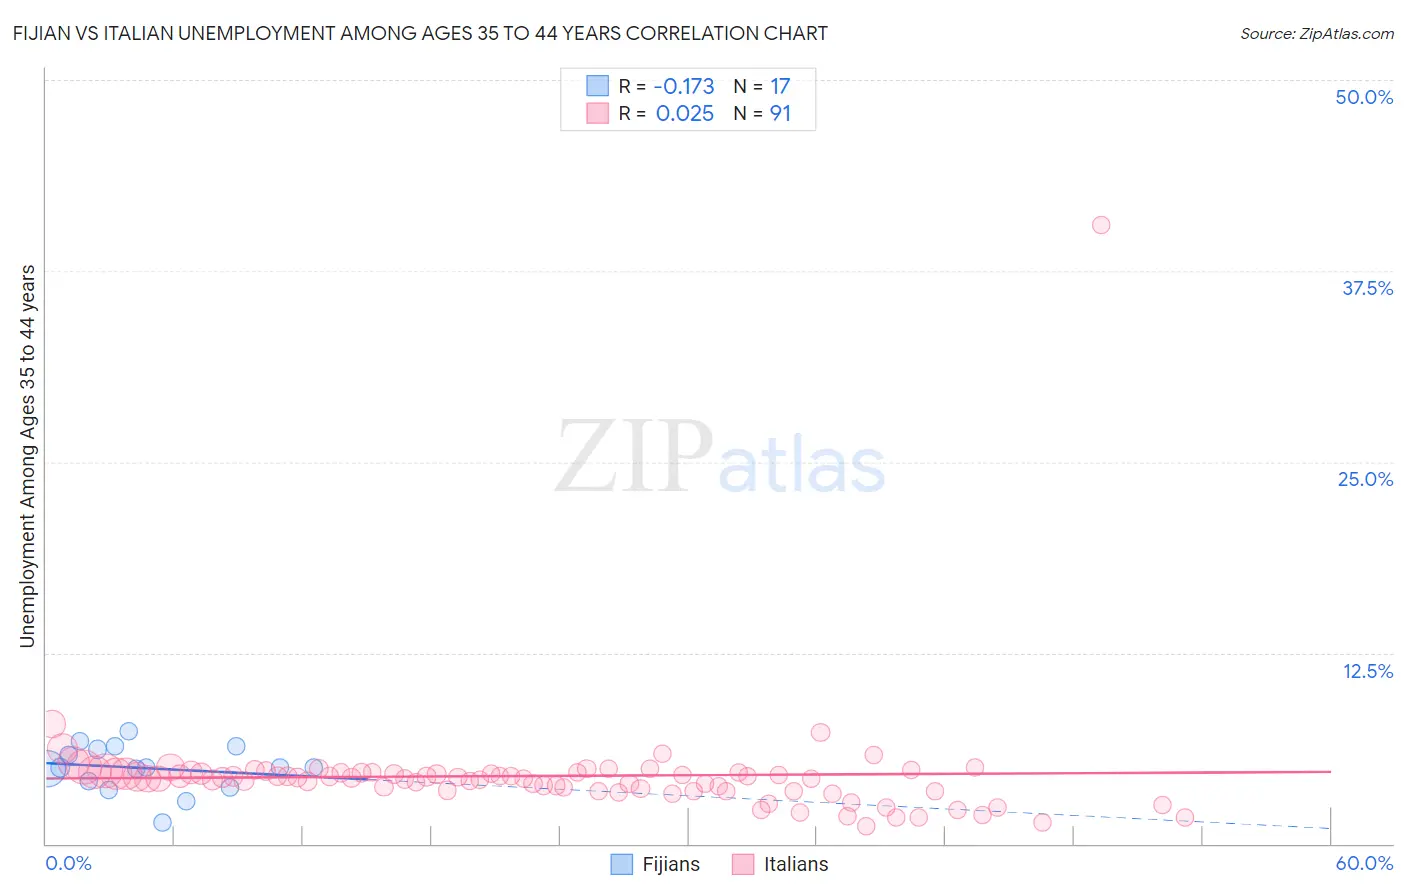
Fijian vs Italian Unemployment Among Ages 35 to 44 years Correlation Chart
The statistical analysis conducted on geographies consisting of 55,621,019 people shows a poor negative correlation between the proportion of Fijians and unemployment rate among population between the ages 35 and 44 in the United States with a correlation coefficient (R) of -0.173 and weighted average of 4.9%. Similarly, the statistical analysis conducted on geographies consisting of 534,997,275 people shows no correlation between the proportion of Italians and unemployment rate among population between the ages 35 and 44 in the United States with a correlation coefficient (R) of 0.025 and weighted average of 4.5%, a difference of 8.9%.
Unemployment Among Ages 35 to 44 years Correlation Summary
| Measurement | Fijian | Italian |
| Minimum | 1.4% | 1.2% |
| Maximum | 7.4% | 40.5% |
| Range | 6.0% | 39.3% |
| Mean | 4.9% | 4.4% |
| Median | 5.0% | 4.3% |
| Interquartile 25% (IQ1) | 3.9% | 3.4% |
| Interquartile 75% (IQ3) | 6.3% | 4.7% |
| Interquartile Range (IQR) | 2.4% | 1.2% |
| Standard Deviation (Sample) | 1.5% | 4.0% |
| Standard Deviation (Population) | 1.5% | 4.0% |
Similar Demographics by Unemployment Among Ages 35 to 44 years
Demographics Similar to Fijians by Unemployment Among Ages 35 to 44 years
In terms of unemployment among ages 35 to 44 years, the demographic groups most similar to Fijians are Osage (4.9%, a difference of 0.010%), Immigrants from Africa (4.9%, a difference of 0.10%), Nonimmigrants (4.9%, a difference of 0.16%), Immigrants (4.9%, a difference of 0.16%), and Immigrants from Cameroon (4.9%, a difference of 0.52%).
| Demographics | Rating | Rank | Unemployment Among Ages 35 to 44 years |
| Spaniards | 18.7 /100 | #205 | Poor 4.8% |
| Soviet Union | 18.4 /100 | #206 | Poor 4.8% |
| Immigrants | Western Asia | 16.6 /100 | #207 | Poor 4.8% |
| French Canadians | 16.5 /100 | #208 | Poor 4.8% |
| Immigrants | Uruguay | 11.5 /100 | #209 | Poor 4.9% |
| Immigrants | Cameroon | 11.4 /100 | #210 | Poor 4.9% |
| Immigrants | Nonimmigrants | 9.4 /100 | #211 | Tragic 4.9% |
| Fijians | 8.7 /100 | #212 | Tragic 4.9% |
| Osage | 8.6 /100 | #213 | Tragic 4.9% |
| Immigrants | Africa | 8.2 /100 | #214 | Tragic 4.9% |
| Immigrants | Immigrants | 8.0 /100 | #215 | Tragic 4.9% |
| Americans | 6.2 /100 | #216 | Tragic 4.9% |
| Moroccans | 6.0 /100 | #217 | Tragic 4.9% |
| Chickasaw | 5.7 /100 | #218 | Tragic 4.9% |
| Sierra Leoneans | 4.8 /100 | #219 | Tragic 4.9% |
Demographics Similar to Italians by Unemployment Among Ages 35 to 44 years
In terms of unemployment among ages 35 to 44 years, the demographic groups most similar to Italians are Immigrants from Netherlands (4.5%, a difference of 0.010%), Immigrants from Sudan (4.5%, a difference of 0.040%), Welsh (4.5%, a difference of 0.070%), Immigrants from Egypt (4.5%, a difference of 0.090%), and Finnish (4.5%, a difference of 0.090%).
| Demographics | Rating | Rank | Unemployment Among Ages 35 to 44 years |
| Iranians | 93.9 /100 | #93 | Exceptional 4.5% |
| Russians | 93.8 /100 | #94 | Exceptional 4.5% |
| Yugoslavians | 93.6 /100 | #95 | Exceptional 4.5% |
| Scottish | 93.5 /100 | #96 | Exceptional 4.5% |
| Immigrants | France | 92.5 /100 | #97 | Exceptional 4.5% |
| Immigrants | Canada | 92.3 /100 | #98 | Exceptional 4.5% |
| Immigrants | Egypt | 92.3 /100 | #99 | Exceptional 4.5% |
| Italians | 91.9 /100 | #100 | Exceptional 4.5% |
| Immigrants | Netherlands | 91.9 /100 | #101 | Exceptional 4.5% |
| Immigrants | Sudan | 91.8 /100 | #102 | Exceptional 4.5% |
| Welsh | 91.6 /100 | #103 | Exceptional 4.5% |
| Finns | 91.6 /100 | #104 | Exceptional 4.5% |
| Immigrants | Saudi Arabia | 91.3 /100 | #105 | Exceptional 4.5% |
| Immigrants | North America | 91.1 /100 | #106 | Exceptional 4.5% |
| Immigrants | North Macedonia | 90.7 /100 | #107 | Exceptional 4.5% |