Puget Sound Salish vs Immigrants from Liberia Unemployment Among Ages 35 to 44 years
COMPARE
Puget Sound Salish
Immigrants from Liberia
Unemployment Among Ages 35 to 44 years
Unemployment Among Ages 35 to 44 years Comparison
Puget Sound Salish
Immigrants from Liberia
4.6%
UNEMPLOYMENT AMONG AGES 35 TO 44 YEARS
67.1/ 100
METRIC RATING
151st/ 347
METRIC RANK
5.2%
UNEMPLOYMENT AMONG AGES 35 TO 44 YEARS
0.2/ 100
METRIC RATING
249th/ 347
METRIC RANK
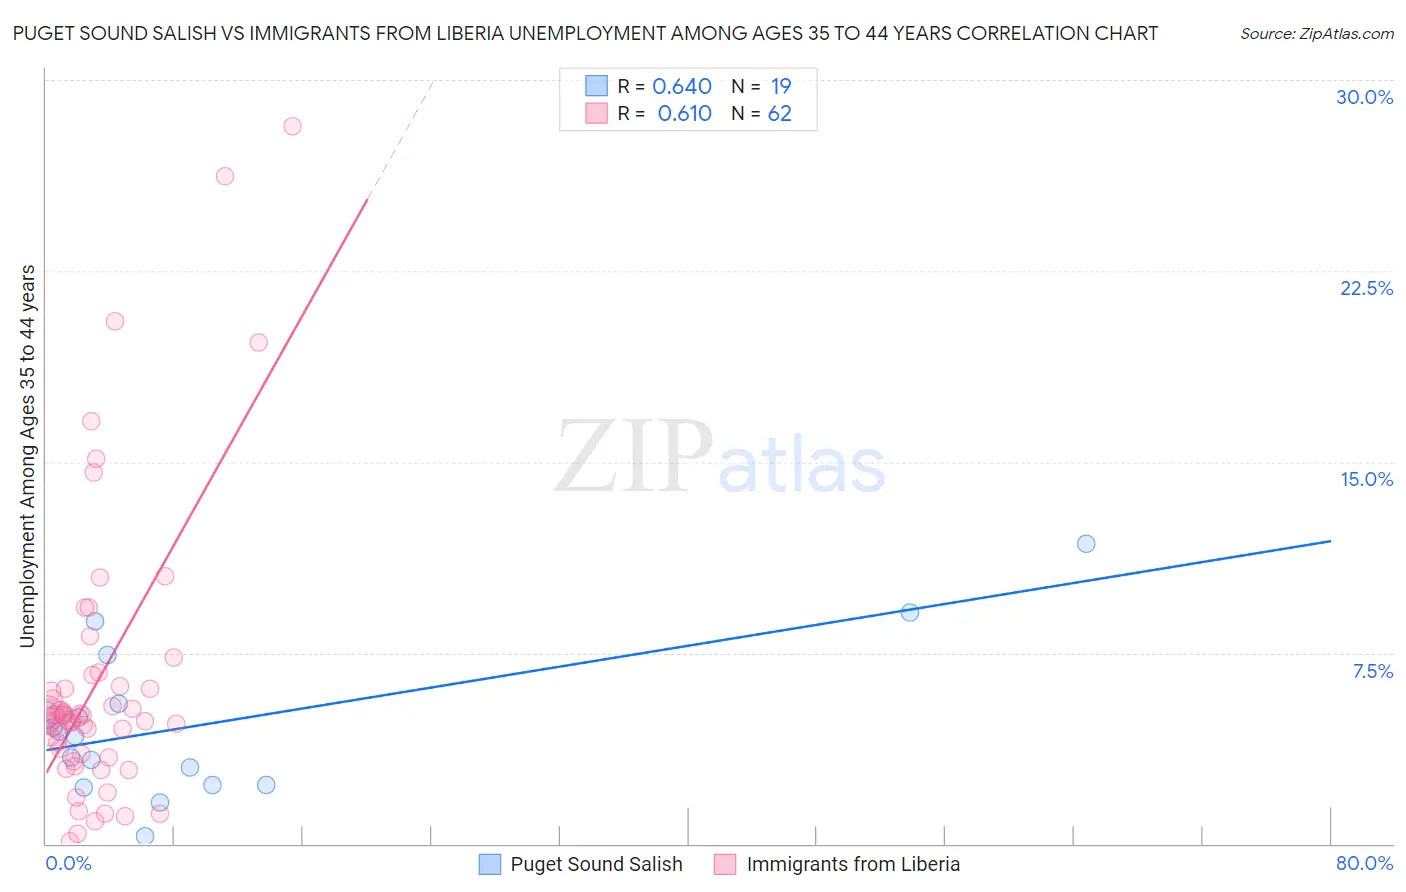
Puget Sound Salish vs Immigrants from Liberia Unemployment Among Ages 35 to 44 years Correlation Chart
The statistical analysis conducted on geographies consisting of 45,742,187 people shows a significant positive correlation between the proportion of Puget Sound Salish and unemployment rate among population between the ages 35 and 44 in the United States with a correlation coefficient (R) of 0.640 and weighted average of 4.6%. Similarly, the statistical analysis conducted on geographies consisting of 134,638,060 people shows a significant positive correlation between the proportion of Immigrants from Liberia and unemployment rate among population between the ages 35 and 44 in the United States with a correlation coefficient (R) of 0.610 and weighted average of 5.2%, a difference of 12.1%.
Unemployment Among Ages 35 to 44 years Correlation Summary
| Measurement | Puget Sound Salish | Immigrants from Liberia |
| Minimum | 0.30% | 0.10% |
| Maximum | 11.8% | 28.2% |
| Range | 11.5% | 28.1% |
| Mean | 4.7% | 6.4% |
| Median | 4.4% | 5.0% |
| Interquartile 25% (IQ1) | 2.3% | 3.5% |
| Interquartile 75% (IQ3) | 5.5% | 6.2% |
| Interquartile Range (IQR) | 3.2% | 2.7% |
| Standard Deviation (Sample) | 2.9% | 5.6% |
| Standard Deviation (Population) | 2.8% | 5.6% |
Similar Demographics by Unemployment Among Ages 35 to 44 years
Demographics Similar to Puget Sound Salish by Unemployment Among Ages 35 to 44 years
In terms of unemployment among ages 35 to 44 years, the demographic groups most similar to Puget Sound Salish are Pakistani (4.6%, a difference of 0.0%), Immigrants from Brazil (4.6%, a difference of 0.010%), Immigrants from Western Europe (4.6%, a difference of 0.13%), White/Caucasian (4.6%, a difference of 0.18%), and South American (4.6%, a difference of 0.27%).
| Demographics | Rating | Rank | Unemployment Among Ages 35 to 44 years |
| Immigrants | Russia | 75.4 /100 | #144 | Good 4.6% |
| Immigrants | Eastern Europe | 74.7 /100 | #145 | Good 4.6% |
| Immigrants | Denmark | 74.4 /100 | #146 | Good 4.6% |
| Immigrants | Vietnam | 73.8 /100 | #147 | Good 4.6% |
| Slavs | 72.4 /100 | #148 | Good 4.6% |
| Immigrants | Burma/Myanmar | 72.2 /100 | #149 | Good 4.6% |
| Immigrants | England | 70.5 /100 | #150 | Good 4.6% |
| Puget Sound Salish | 67.1 /100 | #151 | Good 4.6% |
| Pakistanis | 67.1 /100 | #152 | Good 4.6% |
| Immigrants | Brazil | 67.0 /100 | #153 | Good 4.6% |
| Immigrants | Western Europe | 65.5 /100 | #154 | Good 4.6% |
| Whites/Caucasians | 64.9 /100 | #155 | Good 4.6% |
| South Americans | 63.7 /100 | #156 | Good 4.6% |
| Immigrants | Belarus | 63.4 /100 | #157 | Good 4.6% |
| Immigrants | Iran | 63.1 /100 | #158 | Good 4.6% |
Demographics Similar to Immigrants from Liberia by Unemployment Among Ages 35 to 44 years
In terms of unemployment among ages 35 to 44 years, the demographic groups most similar to Immigrants from Liberia are Alsatian (5.2%, a difference of 0.030%), Immigrants from El Salvador (5.2%, a difference of 0.040%), Comanche (5.2%, a difference of 0.47%), Immigrants from Somalia (5.2%, a difference of 0.53%), and Armenian (5.2%, a difference of 0.60%).
| Demographics | Rating | Rank | Unemployment Among Ages 35 to 44 years |
| Delaware | 0.5 /100 | #242 | Tragic 5.1% |
| Salvadorans | 0.4 /100 | #243 | Tragic 5.1% |
| Guatemalans | 0.4 /100 | #244 | Tragic 5.1% |
| Bahamians | 0.4 /100 | #245 | Tragic 5.2% |
| Immigrants | Guatemala | 0.4 /100 | #246 | Tragic 5.2% |
| Immigrants | Somalia | 0.3 /100 | #247 | Tragic 5.2% |
| Alsatians | 0.2 /100 | #248 | Tragic 5.2% |
| Immigrants | Liberia | 0.2 /100 | #249 | Tragic 5.2% |
| Immigrants | El Salvador | 0.2 /100 | #250 | Tragic 5.2% |
| Comanche | 0.2 /100 | #251 | Tragic 5.2% |
| Armenians | 0.2 /100 | #252 | Tragic 5.2% |
| Mexican American Indians | 0.2 /100 | #253 | Tragic 5.2% |
| Immigrants | Bahamas | 0.2 /100 | #254 | Tragic 5.2% |
| Cherokee | 0.2 /100 | #255 | Tragic 5.2% |
| Seminole | 0.1 /100 | #256 | Tragic 5.2% |